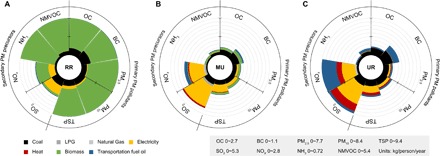
Fig. 4. Per-capita RTC emissions of primary PM pollutants and secondary PM precursors in China by fuel.

Per-capita RTC emissions of RRs (A), MUs (B), and URs (C). The axis ranges of different pollutants are different, as shown in the legend. The per-capita emissions shown in the graphs are national averages in 2010. See figs. S4 and S5 for the per-capita emissions in 1990 and 2030. NMVOC, non-methane volatile organic compounds; TSP, total suspended particulate matter.
