
Fig. 1. Evolutionary history of the great cats.
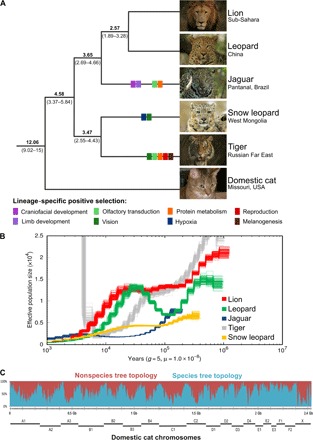
(A) Species tree of the genus Panthera estimated from genome-wide data. All five extant species are represented as follows: lion (Panthera leo), leopard (P. pardus), jaguar (Panthera onca), snow leopard (Panthera uncia), and tiger (Panthera tigris). Numbers above branches indicate the estimated age [in million years ago (Ma)] of the adjacent node, averaged across all genomic windows (100-kb window size, 100-kb steps) that conform to the species tree (95% highest posterior density interval below the respective branch). Colored rectangles on terminal branches indicate phenotypic categories (defined below the tree; see Fig. 3B for more details) affected by species-specific episodes of positive selection. (B) PSMC plot depicting the demographic history of the five Panthera species inferred from genomic data. (C) Genealogical discordance across the genome of Panthera cats, demonstrated by a sliding window analysis (500-kb window size, 100-kb steps) of a full-genome alignment mapped to domestic cat chromosomes (gray lines at the bottom). The y axis indicates the percentage of overlapping windows within a given interval that conform to (blue) or reject (red) the species tree. Photo credits: D. Kantek (jaguar); C. Sperka (others).