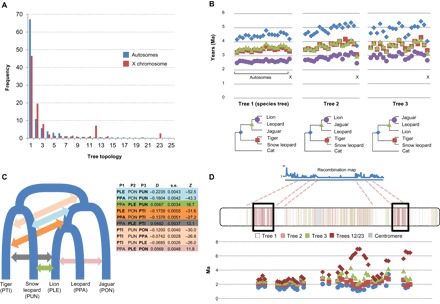
Fig. 2. In-depth characterization of phylogenetic discordance in the Panthera.

(A) Frequencies of the species tree (Tree 1) and alternative topologies on pooled autosomes (blue) and the X chromosome (red). Trees 12 and 23 show the leopard in a basal position relative to the other species (tables S6 and S7). (B) Chromosome-wide mean divergence times (in Ma), calculated from 100-kb windows that yielded the three most frequent topologies (shown below the graphs; nodes are color-coded). Note the marked drop in divergence time on the X chromosome for non–species tree topologies. (C) Complex patterns of historical admixture among Panthera lineages, inferred from ABBA/BABA tests. Colored arrows indicate the phylogenetic position of significant D statistics (shown in the table) for different species trios, using the domestic cat as the outgroup. Species codes in bold types indicate pairs for which significant evidence of admixture was detected. (D) Patterns of phylogenetic discordance along the X chromosome (estimated in 100-kb windows) correlate with the recombination landscape (10). Regions depicting species tree relationships (Tree 1), shown in white, correspond to higher recombination rates, whereas recombination deserts are enriched for alternative topologies with reduced divergence times (a signature of introgression). Two terminal, lower-recombination regions are enriched for topologies 12 and 23, depicting a basal position for leopard. These regions also harbor tracts of windows with old divergence times between the leopard and the other Panthera.
