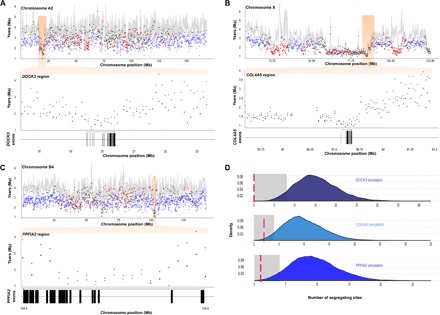
Fig. 4. Genomic evidence of positive selection following interspecific introgression.

(A to C) Graphs depicting variation in age estimates for the trio jaguar-lion-leopard in 100-kb windows across the length of three chromosomes (top) and specific chromosomal segments containing multiple outlier windows with ages significantly younger than the genome-wide average (bottom), indicating introgression. The gray lines in the top panels (gray circles in the bottom panels) represent the basal age of the trio, whereas colored circles represent the age of the internal node in each window (blue, lion-leopard; red, lion-jaguar; green, leopard-jaguar). Below the bottom panels, the annotated exons of a candidate gene located in each focal region are indicated. (D) Intraspecific signals of positive selection in jaguars affecting the three genes highlighted in (A) to (C). The graphs depict the null distribution of the number of segregating sites per gene based on 10,000 demographic simulations (see text); the gray shading indicates significant departure (P < 0.05) from the null expectation, and the red lines represent the observed value for each gene.
