Fig. 3.

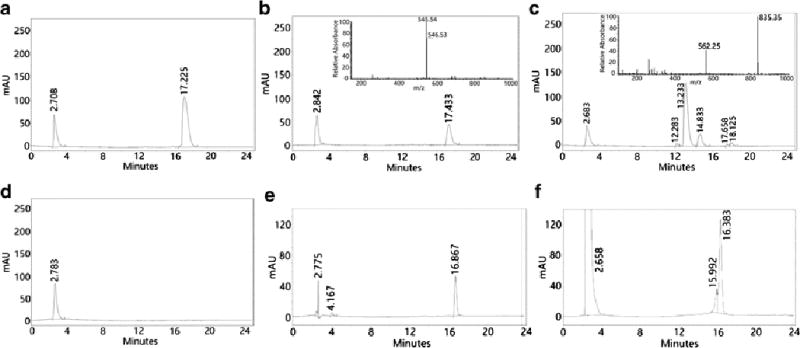
HPLC chromatograms derived from TBOP alone (50 µM) before the reaction of TBOP with BSA (A); reaction mixture of TBOP with BSA (1:10) at room temperature in a Tris buffer (0.1 M, pH 7.4) for 20 min (B); reaction mixture of TBOP with GSH (1:10) at room temperature in a Tris buffer (0.1 M, pH 7.4) for 20 min (C); BSA alone (D). TBOP alone (50 µM) before the reaction of TBOP with protein precipitates from cell homogenates (E); reaction mixture of TBOP with the protein precipitates (F). The HPLC condition is presented in the experimental section except the mobile phase. The mobile phase included solvent A (acetonitrile) and solvent B (0.1% trichloroacetic acid aqueous solution). The initial 2 min was solvent B with 10% solvent A. Solvent A was then linearly increased to 70% in 11 min, and then further increased to 90% in 5 min and kept at 90% for an additional 3 min before back to 10% in 2 min.
