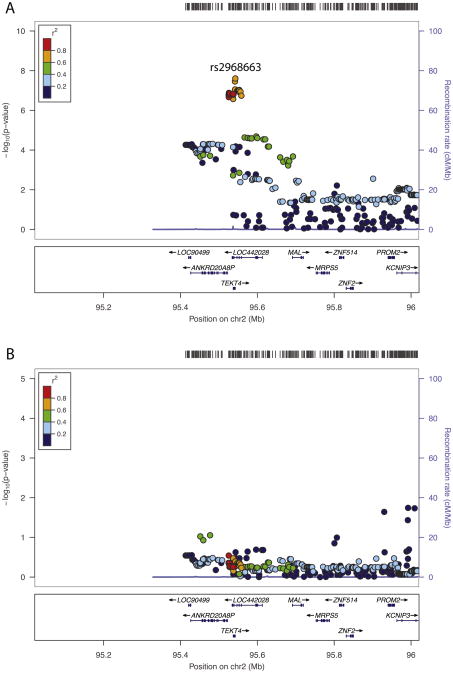
Fig. 11.
Detailed view of the region of chromosome 3 containing significant associations with theta-Fz ITPC. Minus log-transformed significance levels for this region are plotted using the locuszoom software tool to providea detailed viewof this region. A rug plot at the top indicates the distribution of SNP locations. The color of each point in the plot indicates the average LD r2 of that SNP with other SNPs in the region. Genes in the region are displayed at the bottom of the plot. Panel A plots association results for the genome-wide scan. The SNP with the smallest p-value (rs2968663) is labeled. Panel B plots the results of a subsequent analysis that included each subject's value for this SNP as an additional covariate to determine whether there was more than one signal in this region, which would be indicated if strong associations remained after controlling for rs2968663.

