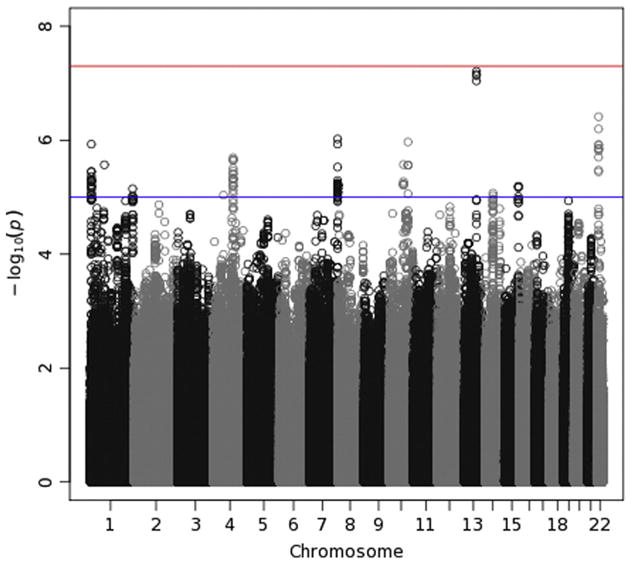
Fig. 7.

Manhattan plot for theta-Fz energy. This plots −log10(p-values) against their location, grouped by chromosome, to permit one to locate regions of significant and subthreshold associations in the genome. Vertical streams of points indicate a region harboring a likely association; LD among nearby SNPs creates a neighborhood of large −log10(p-values). A horizontal red line at 7.3 reflects the genome-wide significance level (5 × 10⁻⁸). A second, blue line is drawn at 5 (p-value of 10−5), which is sometimes used to indicate suggestive significance. (For interpretation of the references to color in this figure legend, the reader is referred to the web version of this article.)
