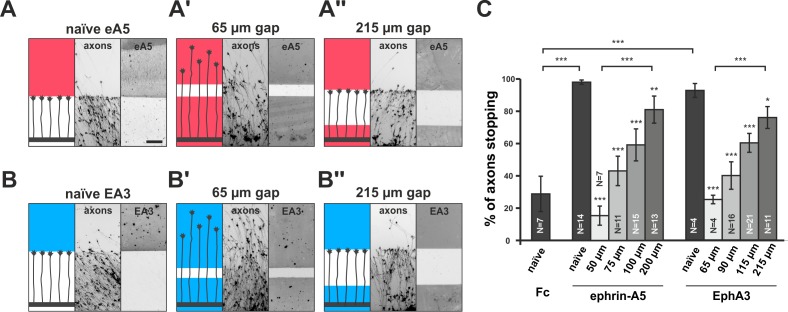
Figure 3. Growth cone adaptation towards substrate-bound ephrin-A5 and EphA3.
Subfigures in (A) and (B) each display a cartoon (left) illustrating the experimental setup consisting of explant (thick black strip), axons and printed guidance protein (colored field(s)), the inverted signal of fluorescent phalloidin-stained axonal actin (middle; explant not shown) and the underlying, antibody-labeled substrate (right) are shown in a detailed view of a representative microscopic image (scale: 100 µm). (A) Naïve temporal axons stop in front of a homogeneous field of ephrin-A5-Fc (eA5 15 µg/ml; red), but do not react to an identical boundary when initially grown on ephrin-A5 after a 65 µm wide gap (A'). Stopping behavior returns in axons having crossed a 215 µm wide, ephrin-free gap (A''). (B–B'') Nasal RGC axons show very similar behavior on EphA3-Fc (EA3 15 µg/ml, blue) gap substrates as described for ephrin-A5 gap assays. (C) Quantification of gap assays. Stop reactions were quantified as the percentage of fibers not entering the protein field after the gap. Fc naïve: 28.8% stopping. eA5 naïve: 98.0%, eA5 50 µm: 15.3%, eA5 75 µm: 43.0%, eA5 100 µm: 59.2%, eA5 200 µm: 81.0% stopping. EA3 naïve: 92.6%, EA3 65 µm: 25.0%, EA3 90 µm: 39.9%, EA3 115 µm: 60.1%, EA3 215 µm: 75.8% stopping. Ephrin-A5 gap assay patterns differ slightly from EphA3 patterns in gap width as a result of a modified stamp geometry. N: number of independent experiments. Error bars represent standard deviations. T-test with *: α <0.05, **: α <0.01, ***: α <0.001.
DOI: http://dx.doi.org/10.7554/eLife.25533.008

