. 2017 Jun 15;6:e25555. doi: 10.7554/eLife.25555

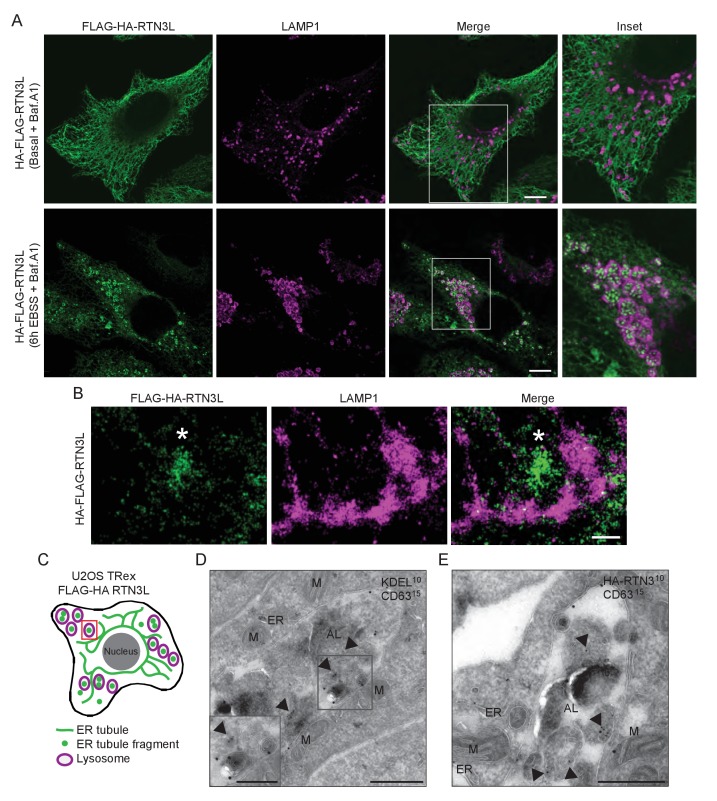
Figure 3. ER tubules fragments are delivered to lysosomes.

(A) Immunofluorescence of HA and LAMP1 in U2OS TRex stable cell lines expressing FLAG-HA-RTN3L in basal growing conditions and after 6 hr starvation with EBSS plus Bafilomycin A1 200 ng/ml. RTN3L level was monitored using an anti HA antibody, while lysosomes were visualized using anti-LAMP1 antibody. Scale bars: 10 µm. (B) Super-resolution fluorescence microscopy (dSTORM) of ER fragments in U2OS TRex FLAG-HA-RTN3L cells stained with anti-HA and anti-LAMP1 antibodies after 6 hr starvation with EBSS plus Bafilomycin A1, 200 ng/ml. Asterisk indicates RTN3L positive ER tubule fragment. Scale bar: 0.5 µm. (C) Schematic representation of ER tubules fragmentation and their delivery to lysosome. The red square indicates the level of high resolution represented in panel B. (D,E) Immuno-gold labelling of cryo-sections using antibodies against CD63 (large dots, diameter 15 nm) and against either the KDEL peptide (D) or the HA tag (E) (small dots, diameter 10 nm). U2OS RTN3L cells were nutrient starved in EBSS for 6 hr in the presence of Bafilomycin A1 before being processed for IEM. AL, autolysosome; M, mitochondrion; ER, endoplasmic reticulum; Arrowheads indicates KDEL-positive ER fragments (D) or HA-RTN3L (E). Scale bar, 500 nm. Enlargement in D shows a detail of a KDEL-positive ER fragment inside an autolysosome. Scale bar, 200 nm.

DOI: http://dx.doi.org/10.7554/eLife.25555.011

Figure 3.

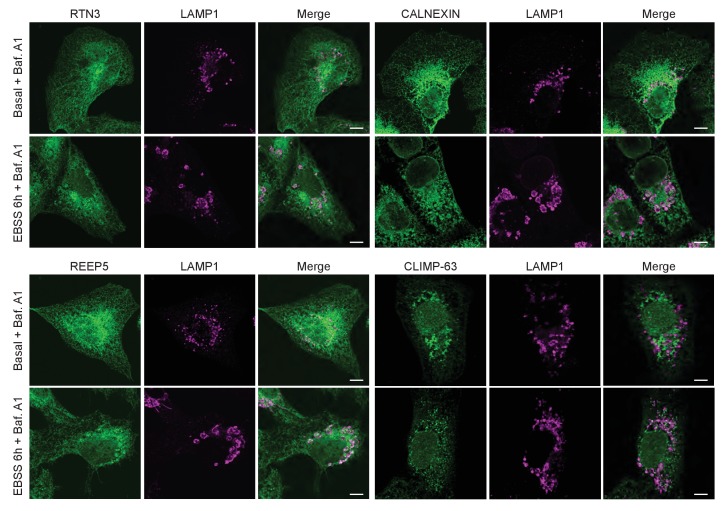
Figure 3—figure supplement 1. EBSS treatment induces fragmentation of the ER and subsequent delivery of the fragments to lysosomes.

Figure 3—figure supplement 1.

Co-staining of U2OS TRex cells with endogenous RTN3, CALNEXIN, REEP5 or CLIMP-63 with the lysosomal marker LAMP1. Cells were grown in standard growing conditions (DMEM with 10% FBS) or treated with EBSS for 6 hr. Scale bars: 10 µm.
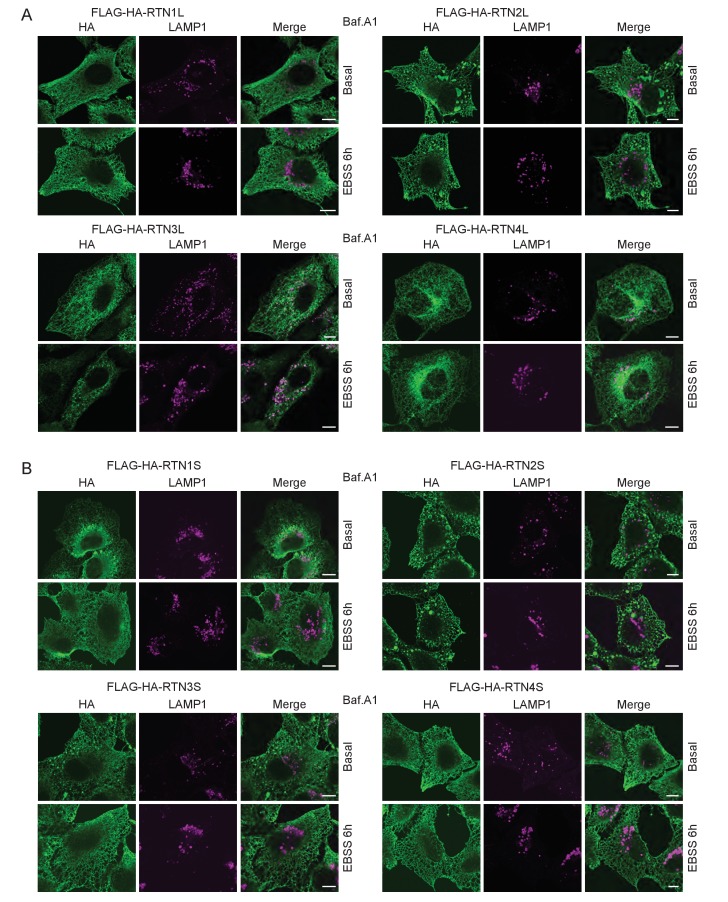
Figure 3—figure supplement 2. ER tubule fragments are delivered to lysosomes after autophagy induction.

Figure 3—figure supplement 2.

(A) Immunofluorescence of HA and LAMP1 in U2OS TRex RTN1-4L and (B) the RTN1-4S cells after 24 hr treatment with 1 µg/ml of doxycycline. Cells were kept in standard growing condition (DMEM with 10% FBS) or starved for 6 hr in EBSS. RTNs were monitored using anti HA antibody, while lysosomes were visualized using LAMP1 antibody. Bafilomycin A1 was added at the final concentration of 200 ng/ml. Scale bars: 10 µm.
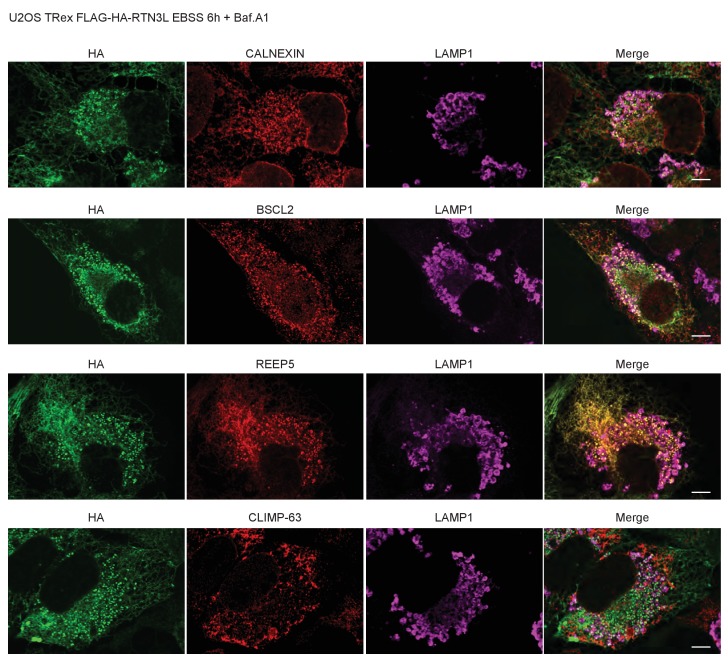
Figure 3—figure supplement 3. RTN3L fragments ER tubules and mediates their delivery to lysosomes.

Figure 3—figure supplement 3.

Immunofluorescence of HA and endogenous CALNEXIN, BSCL2, REEP5, CLIMP-63 and LAMP1 in U2OS TRex RTN3L cells after 24 hr treatment with 1 µg/ml of doxycycline and 6 hr EBSS starvation in the presence of Bafilomycin A1, 200 ng/ml. Scale bars: 10 µm.
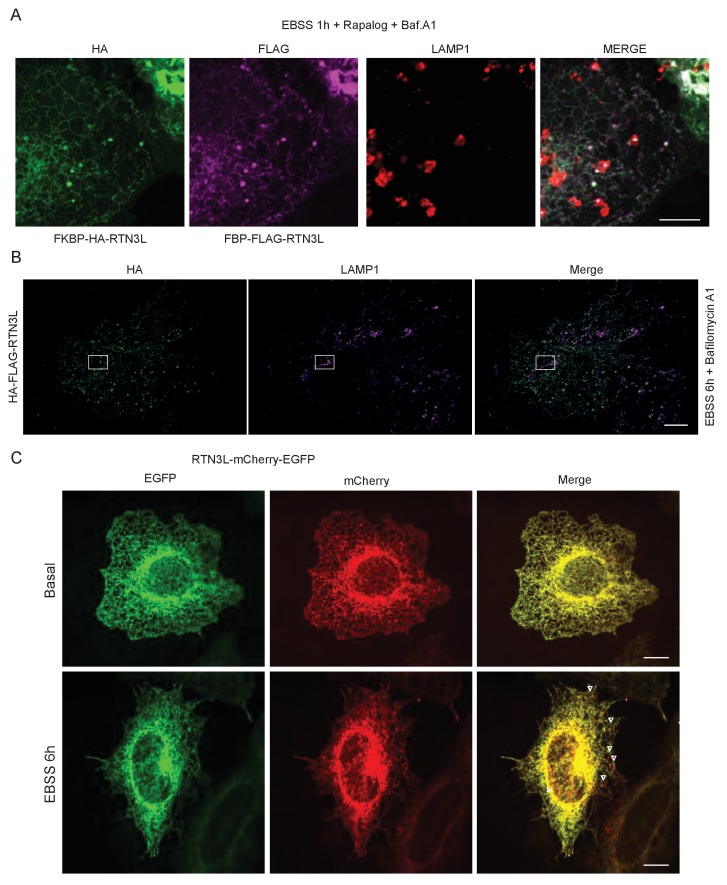
Figure 3—figure supplement 4. RTN3L is degraded via lysosomes during starvation.

Figure 3—figure supplement 4.

(A) U2OS TRex transiently expressing 2XFKBP-HA-RTN3L and FRB-FLAG-RTN3L. 24 hr after transfection, 500 nM Rapalog was added for 2 hr and cells were triple stained with HA, FLAG and LAMP1 after 1 hr EBSS treatment plus 200 ng/ml Bafilomycin A1. Scale bars: 10 µm. (B) Super-resolution fluorescence microscopy (dSTORM) of ER fragments in U2OS TRex FLAG-HA-RTN3L cells stained with anti HA and anti LAMP1 antibodies after 6 hr starvation with EBSS plus Bafilomycin A1, 200 ng/ml. Scale bar 5 µm. The white box indicates the magnification reported in Figure 3B. (C) HeLa TRex mCherry-EGFP-RTN3L cells were treated with 1 µg/ml doxycycline for 24 hr and starved with EBSS for 6 hr in the absence of Bafilomycin A1. Scale bars: 10 µm.
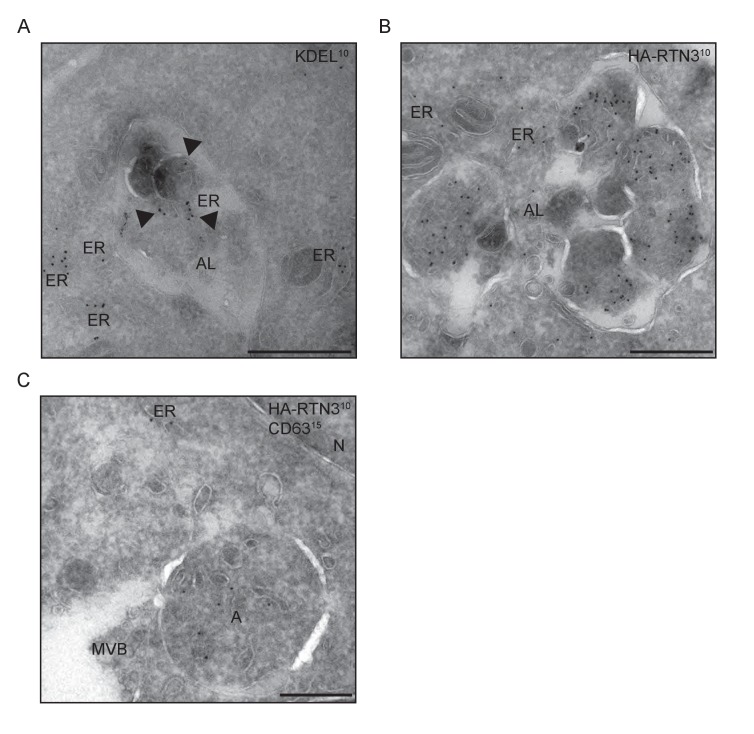
Figure 3—figure supplement 5. ER membranes and RTN3L are present in autolysosomes.

Figure 3—figure supplement 5.

U2OS RTN3L cells were nutrient starved in EBSS for 6 hr in the presence of Bafilomycin A1, 200 ng/ml. (A) Immuno-gold labelling of cryo-sections using antibodies against the KDEL peptide. (B) Immuno-gold labelling for the HA tag peptide. (C) Double immuno-gold labelling against CD63 (large dots, diameter 15 nm) and the HA tag (small dots, diameter 10 nm). AL, autolysosome; N, nucleus; ER, endoplasmic reticulum; MVB, multi-vesicular bodies; A, autophagosome. Scale bar 500 nm.