. 2017 Jun 15;6:e25555. doi: 10.7554/eLife.25555

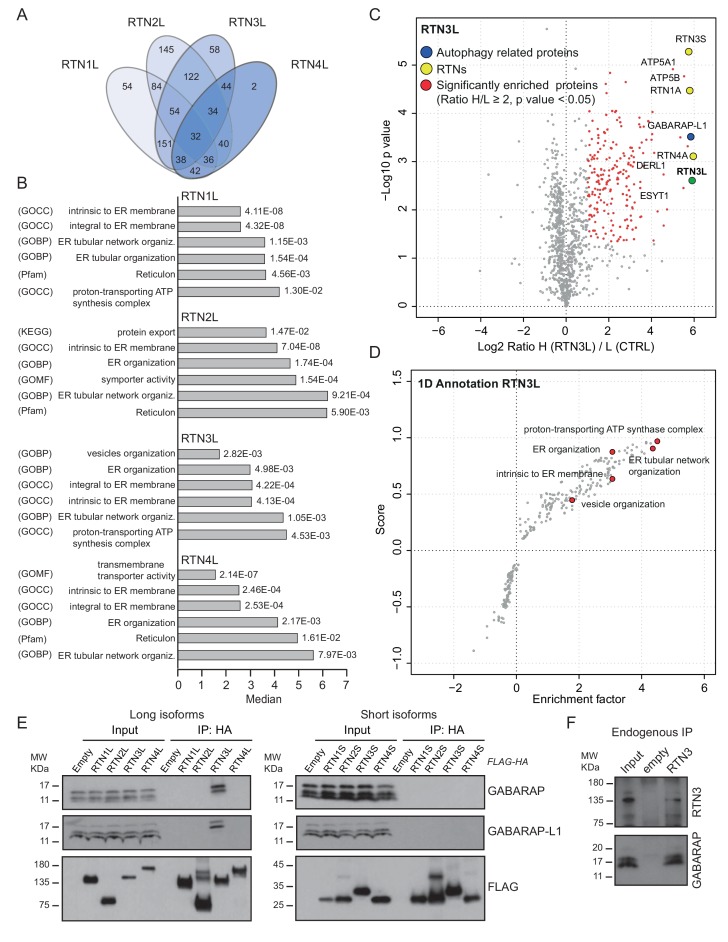
Figure 5. RTN3 interacts with the autophagy modifiers.

(A) Venn diagrams of the interactors of the four RTNs. Numbers represent the identified peptides significantly enriched in three IP and mass spectrometry replicates for each RTN. (B) Annotation enrichment analysis of the interactors of long RTN1-4 isoforms. Bars represent the significantly enriched gene ontology biological process (GOBP), the gene ontology cellular components (GOCC), the gene ontology molecular function (GOMF), the over-expressed pathways (KEGG) and the domain enrichment (Pfam). The numeric value on the right side of the bar shows the Benjamini-Hochberg FDR value. (C) Scatter-plot for 1D annotation enrichment analysis of RTN3L interactor partners significantly enriched in three different IPs. (D) Volcano-plot for RTN3L SILAC-based interactome. Peptides with and Log2 Ratio H/L ≥1 and –Log10 p value > 1.3 are labeled in red. Three biological replicates were analyzed. (E) Co-IP of endogenous GABARAP and GABARAP-L1 with over-expressed long and short isoforms of RTN1-4. Over-expression was induced for 24 hr in U2OS TRex stable cell lines using 1 µg/ml of doxycycline. Bafilomycin A1 was added at the final concentration of 200 ng/ml for 2 hr. (F) Endogenous Co-IP of RTN3 with GABARAP in A549 cells. The ‘empty’ lane represents unconjugated beads. Bafilomycin A1, 200 ng/ml, was added for 2 hr.

DOI: http://dx.doi.org/10.7554/eLife.25555.019

Figure 5—source data 1. IP-interactome of RTN1, RTN2, RTN3 and RTN4 long isoforms.
IP-interactome analyses were performed using the SILAC-labeling strategy in U2OS after 24-hr treatment with 1 µg/ml of doxycycline. Bafilomycin A1, 200 ng/ml, was added for 2 hr. Peptides with Log2 (Heavy/Light [H/L]) ratios ≥1 and a p value ≤ 0.05 were considered significantly enriched.
DOI: 10.7554/eLife.25555.020
Figure 5—source data 2. IP-interactome of RTN1, RTN2, RTN3 and RTN4 short isoforms.
IP-interactome analyses were performed using the SILAC labeling strategy in U2OS after 24-hr treatment with 1 µg/ml of doxycycline. Bafilomycin A1, 200 ng/ml, was added for 2 hr. Peptides with Log2 (Heavy/Light [H/L]) ratios ≥ 1 and a p value ≤ 0.05 were considered significantly enriched.
DOI: 10.7554/eLife.25555.021

Figure 5.

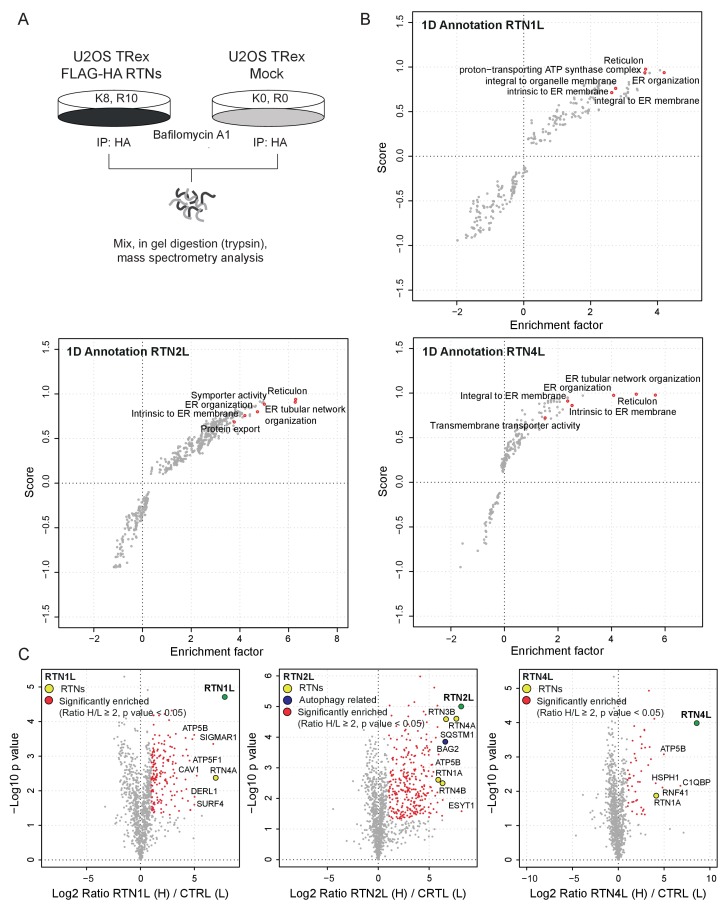
Figure 5—figure supplement 1. Interactome analysis of RTN1-4L.

Figure 5—figure supplement 1.

(A) Schematic representation for the SILAC-based mass spectrometric analysis of RTNs interactomes. (B) Scatter plot for 1D annotation enrichment analysis of RTN1L, RTN2L and RTN4L interactors significantly enriched in three different IP analyzed by mass spectrometry. (C) Volcano-plot for RTN1L, RTN2L and RTN4L SILAC-based interactomes. Interacting partners of each RTNs with and Log2 Ratio H/L >1 and –Log10 p value > 1.3 are labeled in red. Each volcano-plot represents three independent experiments.
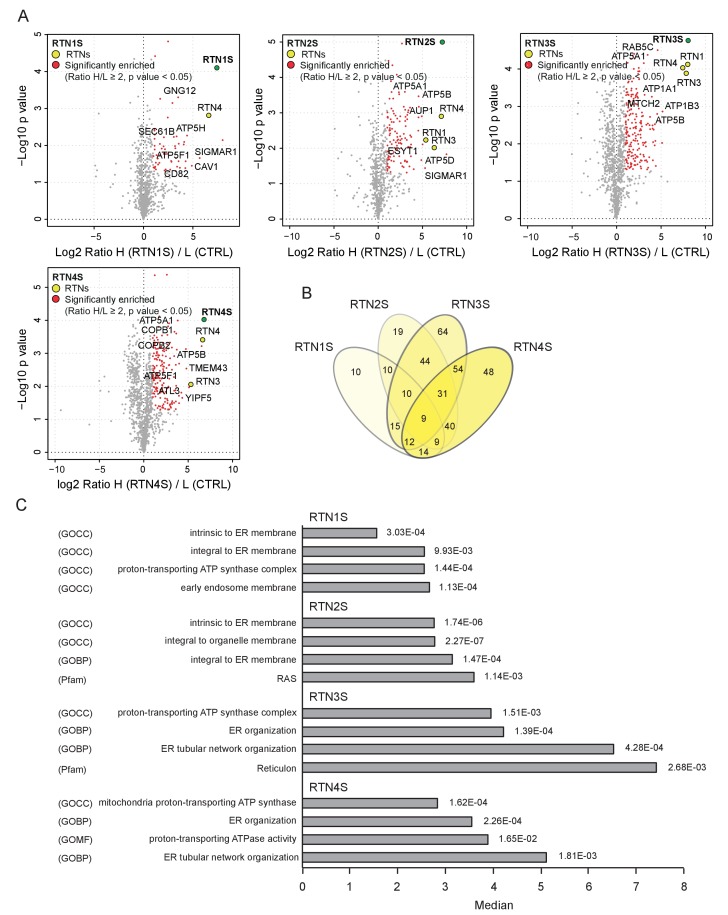
Figure 5—figure supplement 2. Interactome analysis of RTN1-4S.

Figure 5—figure supplement 2.

(A) Volcano-plot for RTN1-4 short isoforms SILAC-based interactomes. Interactors of each RTNs with and Log2 Ratio H/L >1 and –Log10 p value > 1.3 are labeled in red. Each volcano-plot represents three independent experiments. (B) Venn diagrams of the interacting partners for the four RTNs. Numbers represent the identified proteins significantly enriched in three IP and mass spectrometry replicates for each RTN. (C) Annotation enrichment analysis of RTN1-4S interacting partners. The bars represent the significantly enriched gene ontology biological process (GOBP), the gene ontology cellular components (GOCC), the gene ontology molecular function (GOMF) and the domain enrichment (Pfam). The numeric value on the right side of the bar shows the Benjamini-Hochberg FDR.
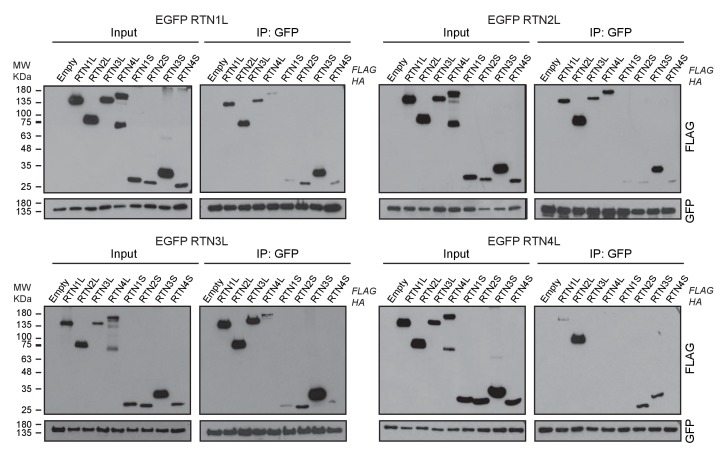
Figure 5—figure supplement 3. RTN1-4 strongly interact amongst themselves.

Figure 5—figure supplement 3.

Co-immuno-precipitation of RTN1-4L indicates the interactions of each RTN with long and short isoforms of the other family members. Proteins were co-overexpressed in HEK293T cells for 24 hr.