
Figure 3.
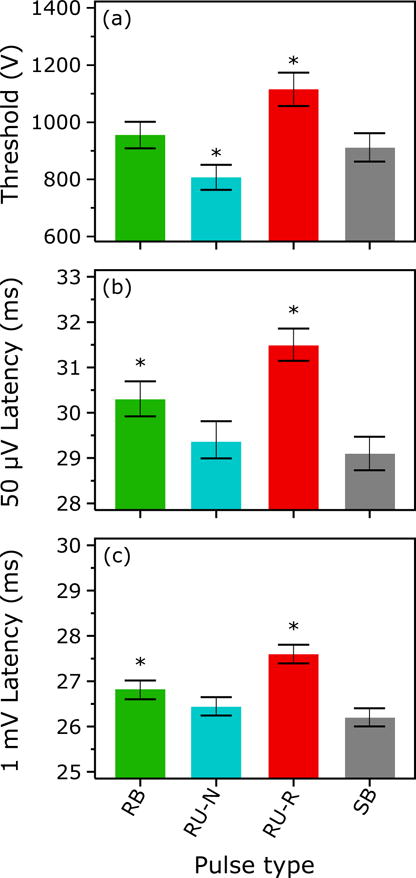
(a) Resting motor thresholds of the four pulse shapes used for rTMS. The threshold is measured as the peak coil voltage to enable comparison between the two different TMS pulse generation devices (cTMS and MagPro) used in the study. (b) Corresponding MEP onset latencies detected in a single-pulse measurement at the resting motor threshold (50 μV peak-to-peak MEP amplitude) in the first session. (c) Same as (b) but for stimulation intensity corresponding to approximately 1 mV peak-to-peak MEP amplitude. Bars and whiskers indicate mean and standard error, respectively. Asterisk (*) indicates conditions that are significantly different from all other conditions (p < 0.05).