
Figure 4.
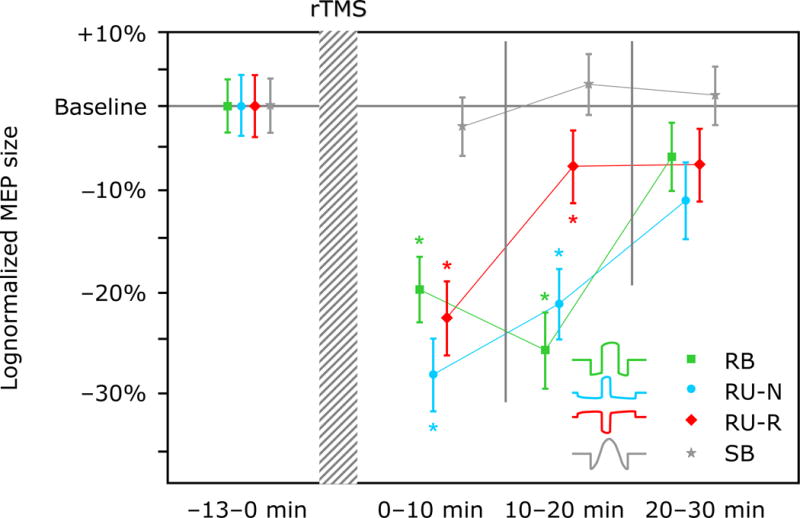
Percentage change of average MEP amplitude relative to baseline after rTMS with each of the four different pulse shapes. The MEP data is binned and log-averaged over three intervals of approximately 10 min duration. Markers and whiskers indicate logmean and lognormal standard error, respectively. Asterisk (*) indicates conditions that are significantly different from baseline (p < 0.05).