
Figure 2. Ectopic Expression of Cdkn1b (P27) in Sox9+ Progenitors Causes Endocrine Cell Differentiation.
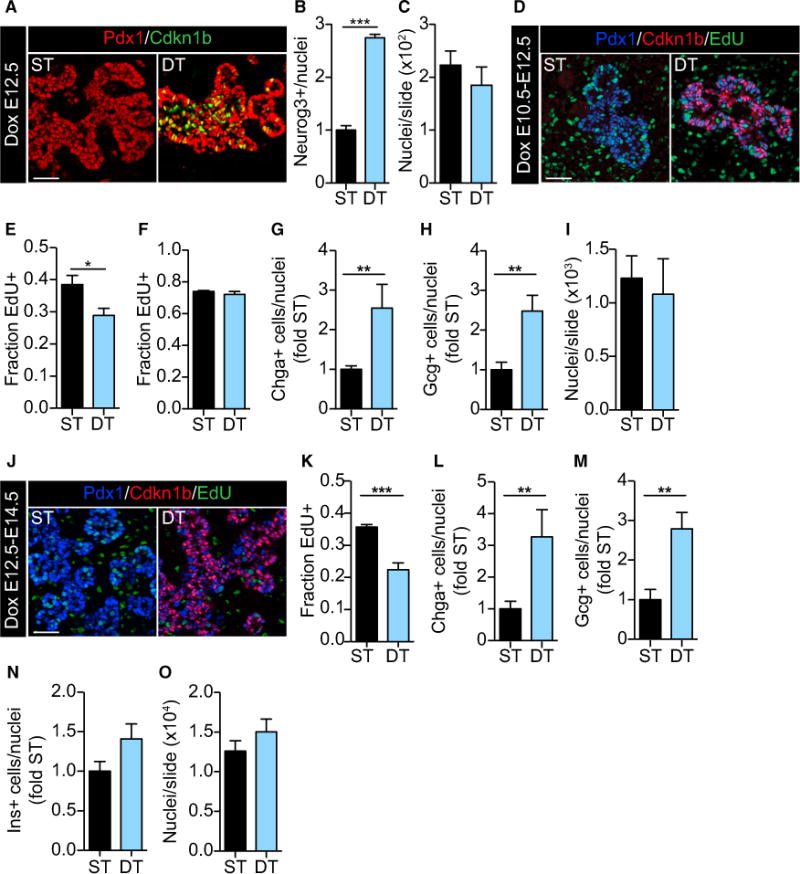
(A) One injection of doxycycline (Dox) at E12.3 increased Cdkn1b (green) expression in the pancreatic epithelium (Pdx1+; red) of double transgenic (DT) but not single transgenic (ST) mice at E12.7.
(B) 9.5 hr of Cdkn1b induction at E12.5 significantly increased the number of Neurog3+ cells in DT embryos. n = 3. ***p < 0.0001 by unpaired t test.
(C) Ectopic expression of Cdkn1b (9.5 hr) did not alter the total number of pancreatic cells. n = 6.
(D) At E12.5, Cdkn1b-expressing (red) pancreatic epithelial cells (Pdx1+; blue) from Dox-treated (E10.5–12.5) DT embryos incorporated less EdU (green) at 3.5 hr.
(E) Significantly fewer Pdx1+EdU+ cells were counted following 3.5 hr of labeling of DT embryos. n = 7. *p < 0.05 by unpaired t test.
(F) Ectopic Cdkn1b expression did not alter the fraction of EdU+ progenitor cells (the GF) after 11 hr of labeling, indicating that cells remained in the cell cycle. n = 3.
(G) Chga+ cells were significantly increased at E12.5 DT embryos following 48 hr of Dox. n = 5. **p < 0.01 by Mann-Whitney U test.
(H) Gcg+ cells were significantly increased at E12.5 in DT embryos following 48 hr of Dox. n = 6. **p < 0.01 by unpaired t test.
(I) Ectopic expression of Cdkn1b (E10.5–12.5) did not reduce total pancreatic cells at E12.5. n = 7.
(J) Dox treatment (E12.5–14.5) of DT embryos increased Cdkn1b (red) expression in subset of Pdx1+ (blue) trunk cells.
(K) Dox-treated (E12.5–14.5) DT embryos showed significantly reduced EdU+ labeling after 3.5 hr at E14.5. n = 4. ***p < 0.0001 by unpaired t test.
(L) More Chga+ cells were present in Dox-treated (E12.5–14.5) DT embryos at E14.5. n = 5. **p < 0.001 by Mann-Whitney U test.
(M) More Gcg+ cells were present in Dox-treated (E12.5–14.5) DT embryos at E14.5. n = 5. **p < 0.01 by unpaired t test.
(N) Ins+ cells were not significantly changed in Dox-treated (E12.5–14.5) DT embryos. n = 9. p = 0.09 by unpaired t test.
(O) The number of pancreatic cells per slide was unchanged, suggesting that growth was not affected by 48 hr of Cdkn1b expression at E14.5. n = 5.
Data are presented as mean ± SEM. Scale bars, 50 μm. See also Figure S2.