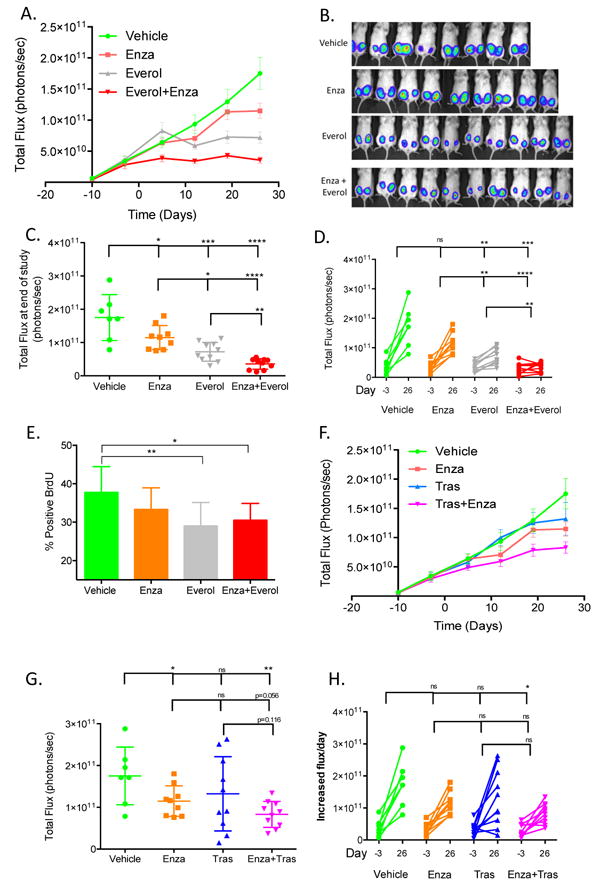
Figure 5. Combination treatment with Enza and Everol or Tras inhibits the growth of Tras-resistant tumors significantly more than single agent treatment.

(A) Total flux growth curve of BT474-HR20 xenografts treated with Enza, Everol, or the combination. Mice (n=10/group) were randomized to one of four treatment groups at day -3 and treatment was initiated at day 0. Mice were sacrificed at day 28 and tumors were harvested. (B, C) IVIS signal on last day of study. (D) Change in total flux from day of randomization to end of study on day 26. (E) BrdU immunohistochemical staining from all tumors in each group. (F) Total flux growth curve of BT474-HR20 xenografts treated with Tras, Enza, or the combination (n=10/group). (G, H) IVIS signal on the last day of study for mice treated with Enza, Tras, or the combination *p<0.05, **p<0.01, ***p<0.001, ****p<0.0001.
