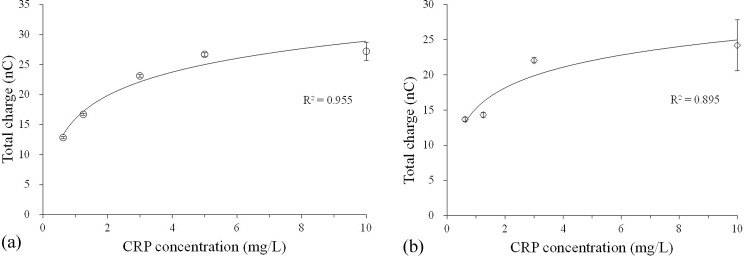
FIG. 7.
The electrical signals of the one-aptamer-only assay and the dual-aptamer sandwich assay; (a) the electrical signals (total charges) of the one-aptamer-only assay detected by the FET for different CRP concentrations ranging from 0.625 to 10.000 mg/l. The total charges increased with CRP concentrations (N = 3). (b) The total charges of the dual-aptamer sandwich assay measured by the FET for different CRP concentrations ranging from 0.625 to 10.000 mg/l. The total charges also increased with CRP concentrations (N = 3). However, they were less than the one from the one-aptamer-only assay at the same concentration of CRP.

