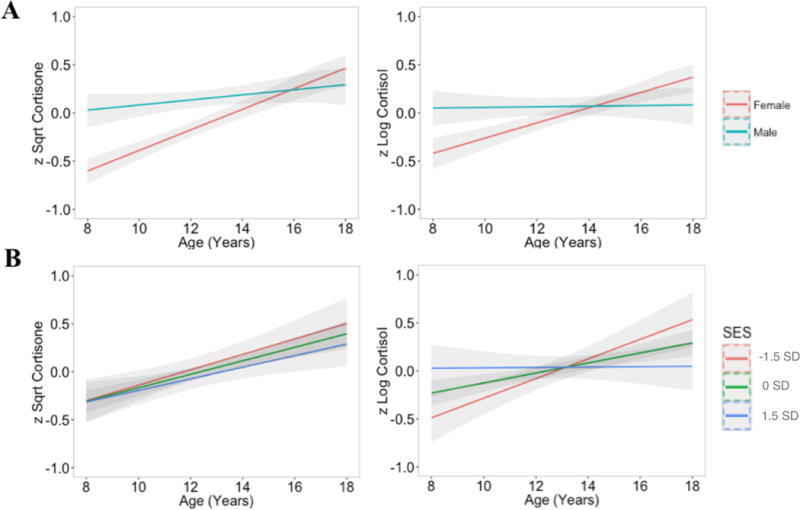
Figure 1.

Moderated age trends in mean levels of cortisone and cortisol by sex (row A) and standardized SES at low (−1.5 SD), average (0 SD), and high (+1.5 SD) levels. (row B). As described in the analyses section, cortisone and cortisol were square root and log transformed, respectively, winsorized and standardized. Gray bands represent 95% confidence intervals.
