
FIGURE 2.
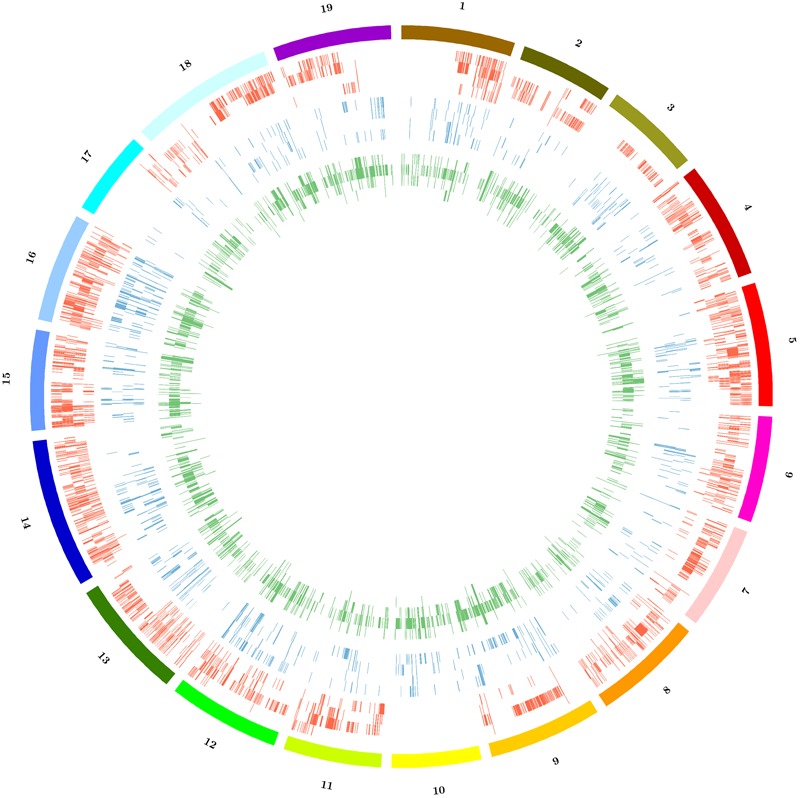
Distribution of copy number variations (CNVs) among the 19 chromosomes of Sardinian cultivars. Color code: red = gains, blue = losses, green = large deletions. For each represented structural variation, the plot represents from outside to inside the cultivars Bovale, Cannonau, Carignano and Vermentino.