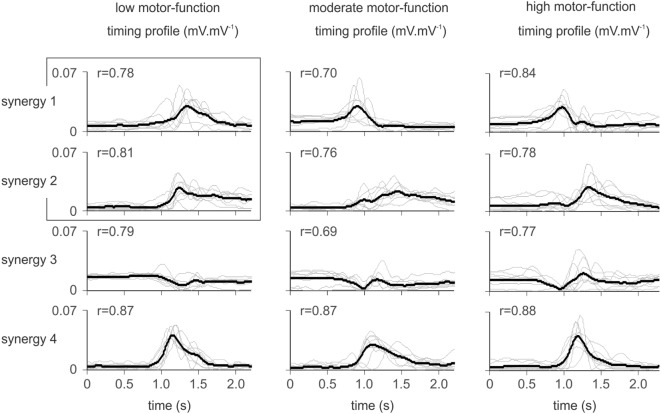
Figure 3.
Synergy activation timing for patients according to the level of residual voluntary motor-function. Thin gray lines illustrate the synergy timing profile for each patient (mean of 10 trials), overlaid by the within-group mean (black line). Similar synergies are overlaid based on the scalar product between synergies. The r-value shown for each synergy indicates the group-averaged scalar product. For patients with low motor-function, the scalar product between mean synergy 1 and 2 indicated similarity (r = 0.71). These two synergies were assumed to be one (as indicated by the overlaid box). Thus, patients with low motor-function used three distinct synergies to define the movement, while patients with moderate and high motor-function required four synergies.

