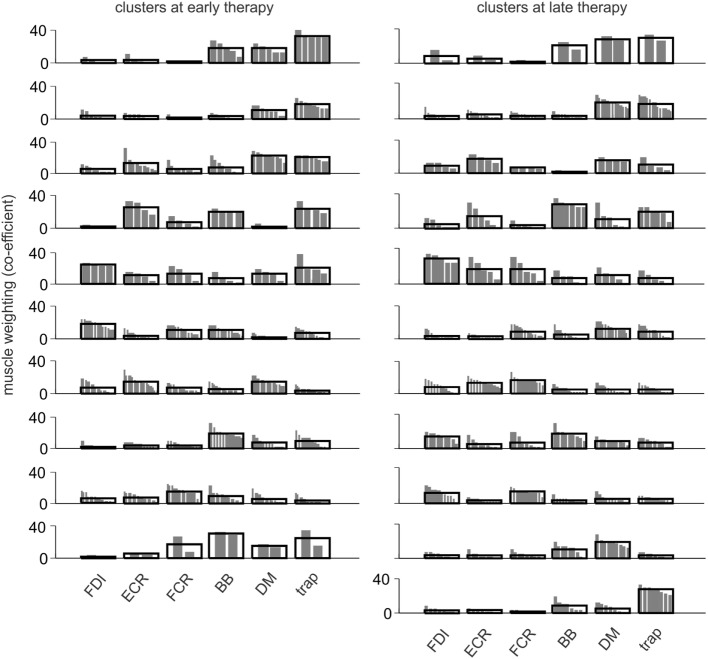
Figure 5.
Composition of muscle synergies at early and late therapy. Synergy muscle weightings at early and late therapy were categorized into 10 and 11 clusters, respectively. For each cluster, the distribution of muscle weightings from different synergies is shown, overlaid by the group mean. The synergy clusters changed from early to late therapy except for the first four clusters.

