Figure 2.

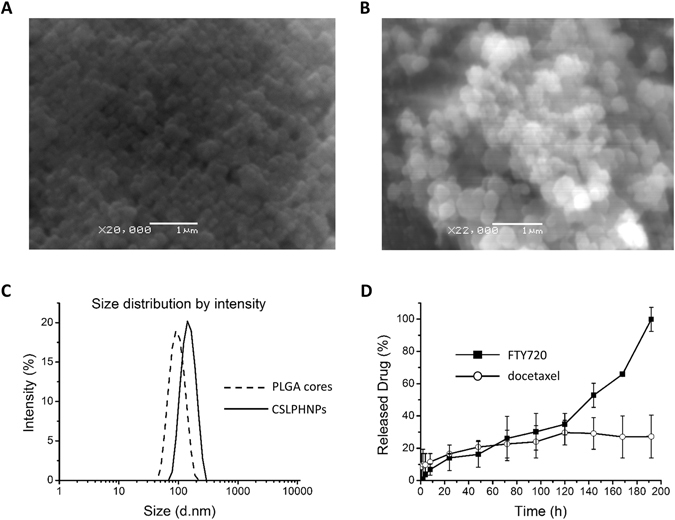
Characterization of CSLPHNPs. Scanning electron microscopy image of (A) PLGA cores and (B) CSLPHNPs; 20,000/22,000X magnification (Scale bar: 1 µm). (C) Dynamic light scattering (DLS) measurement of the size distribution of PLGA cores-dash line, CSLPHNPs-solid line. (D) Temporal release of FTY720 (black squares) and docetaxel (white circles) at pH 5 was measured by liquid chromatography-tandem mass spectrometry (LC-MS/MS). Points, mean of three experiments performed in triplicate. Bars, SE.
