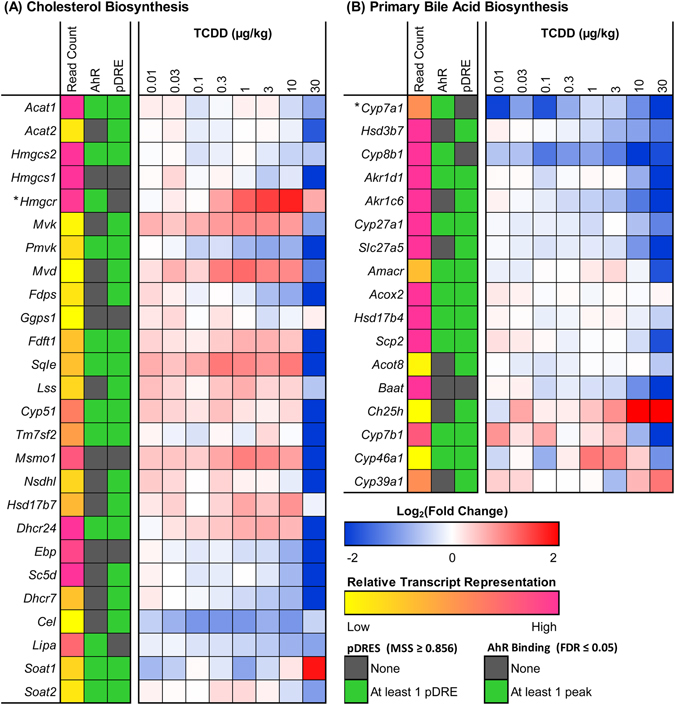
Figure 3.

TCDD-elicited hepatic differential expression of genes involved in (A) cholesterol and (B) primary bile acid biosynthesis in male C57BL/6 mice orally gavaged with sesame oil vehicle or TCDD (0.01–30 µg/kg TCDD) every 4 days for 28 days. Color scale represents the log2(fold change) for differential gene expression relative to vehicle controls, as determined through RNA-Seq analysis (n = 3). The presence of pDREs (MSS ≥ 0.856) and AhR enrichment peaks (FDR ≤ 0.05) at 2 h are shown as green boxes. Read count represents the raw number of aligned reads to each transcript indicating potential level of expression, where yellow represents a lower level of expression (≤500 reads) and pink represents a higher level of expression (≥10,000). The rate-limiting enzyme of each pathway is marked with an asterisk (*).
