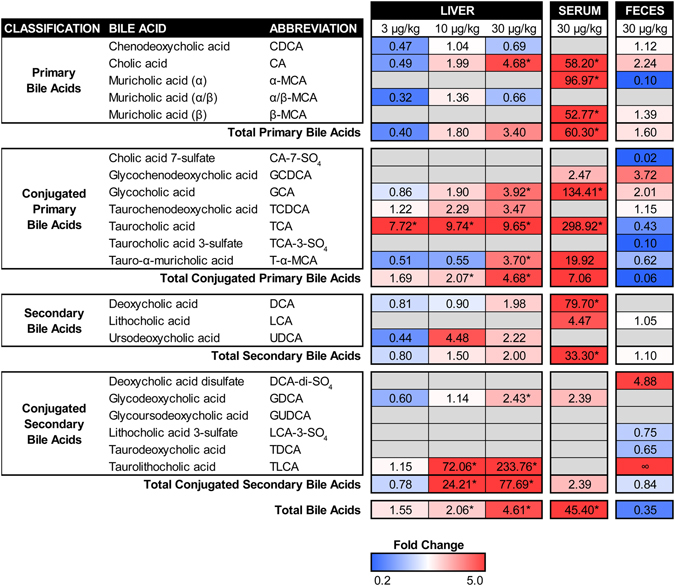
Figure 4.

Bile acid profiles for the liver, serum, and feces of male C57BL/6 mice orally gavaged with sesame oil vehicle or TCDD (3–30 µg/kg) every 4 days for 28 days. Individual bile acid species were quantified using high resolution accurate mass liquid chromatography mass spectrometry and expressed as fold changes relative to vehicle controls. Red and blue indicate increased or decreased levels, respectively, while grey indicates ‘not detected’. ‘∞’ indicates an incalculable increase as the bile acid was detected in treated animals but not controls. Statistical significance (*p ≤ 0.05) was determined using one-way ANOVA analysis followed by Dunnett’s post-hoc test (liver) or a Student’s t-test (serum) performed in SAS 9.3. Fecal pellets were collected from two cages of co-housed mice for each treatment group (n = 2) and therefore statistical analysis was not performed.
