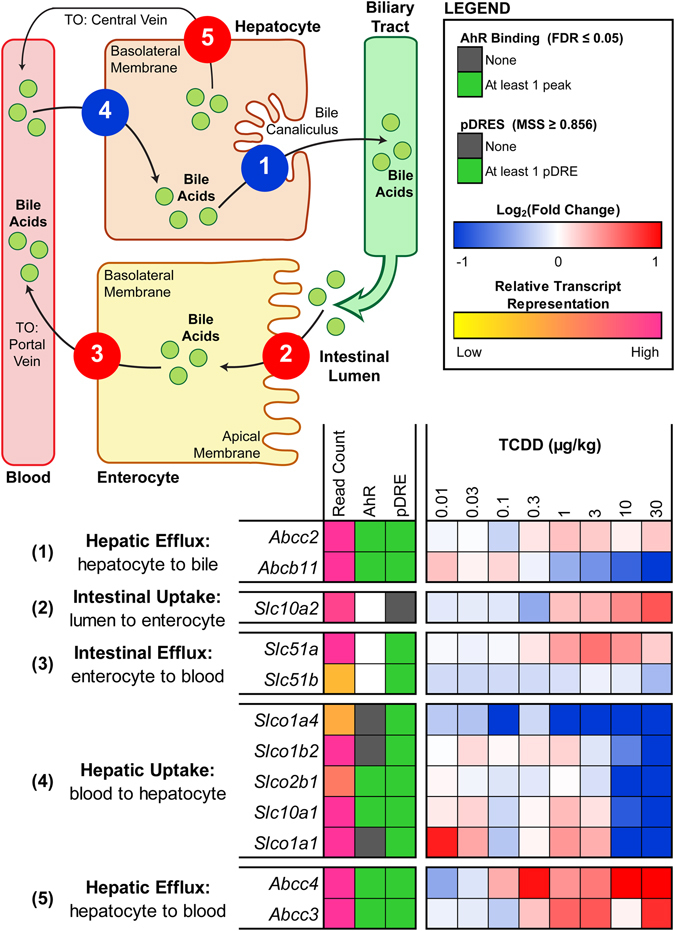
Figure 6.

TCDD-elicited differential expression of bile acid transporters in the liver and ileum of male C57BL/6 mice orally gavaged with sesame oil vehicle or 0.01–30 µg/kg TCDD every 4 days for 28 days. Color scale represents the log2(fold change) for differential gene expression relative to vehicle controls, as determined through RNA-Seq analysis (n = 3). The numeric labels to the left of the heat map correspond to the numbered transport functions in the pictorial representation, where the color of each function represents the overall direction of differential expression exhibited by the group of transporters involved (i.e. induced = red vs. repressed = blue). The presence of pDREs (MSS ≥ 0.856) and hepatic AhR enrichment peaks (FDR ≤ 0.05) at 2 h are shown as green boxes. Read count represents the raw number of aligned reads to each transcript indicating potential level of expression, where yellow represents a lower level of expression (≤500 reads) and pink represents a higher level of expression (≥10,000).
