Figure 5.

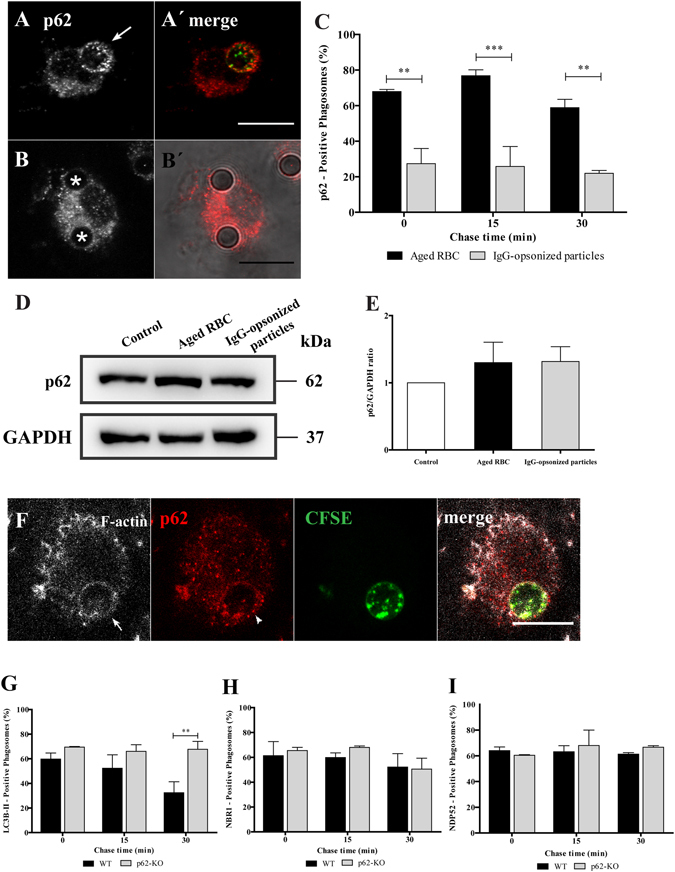
Effect of p62 in the recruitment of LC3B-II, NBR1 and NDP52 to phagosomes containing RBC cells in BMDM. After pulse-chase experiments with RBC or IgG-opsonized particles, WT-BMDM cells were fixed and stained for p62. (A) WT-BMDM containing a p62-positive phagosome at 15 min chase time. (A′) Corresponding merged image showing the internalized RBC stained with CFSE. (B) WT-BMDM containing p62-negative phagosomes at 15 min chase time. (B′) Corresponding merged image showing the internalized IgG-opsonized particles in DIC. (C) Quantification of p62 positive-phagosomes. (D) p62 levels in total cell lysates of WT-BMDM exposed for 15 min to RBC or IgG-opsonized particles. GAPDH was used as loading control. (E) Ratio of p62/GAPDH of quantified bands in cells exposed or not to RBC, IgG-opsonized particles. Three independent experiments were performed. (F) Representative image of RBC-containing phagosome positive for actin (in white) and p62 (in red). Arrow and arrowhead indicate actin- and p62-positive phagosome, respectively. Quantification of LC3B-II- (G), NBR1- (H) and NDP52- (I) positive phagosomes in WT- BMDM (black bars) and p62-KO- BMDM (grey bars). The values are means ± SEM of, at least, three independent experiments. At each time point, at least, 50 phagosomes were analyzed. **p < 0.01; ***p < 0.001 comparing differences between p62-positive phagosomes containing RBC and IgG-opsonized particles or differences between of LC3B-II-positive phagosomes in WT- and p62-KO-BMDM.
