
Figure 6.
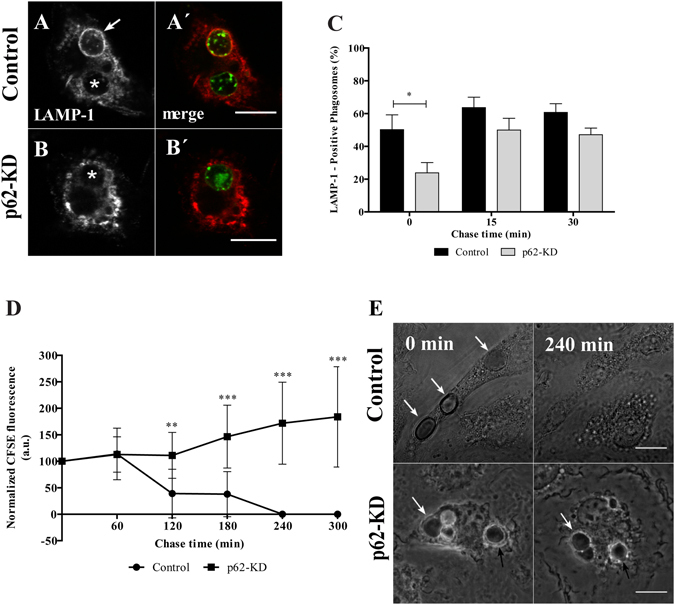
Functional relevance of p62 in RBC degradation. After pulse-chase experiments with RBC, control- and p62-silenced BMDM were fixed and stained for LAMP-1. (A) Control-BMDM containing LAMP1-positive and LAMP1-negative phagosomes at 0 min chase time. (B) p62-KD-BMDM containing a LAMP-1-negative phagosome at 0 min chase time. (A′,B′) Corresponding merged images showing the internalized RBC stained with CFSE. Arrow indicates a LAMP-1-positive phagosome and asterisks (*) indicate LAMP-1-negative phagosomes. (C) Quantification of LAMP-1-positive phagosomes in WT-BMDM (black bars) and p62-KD-BMDM (grey bars). The values are means ± SEM of, at least, three independent experiments. At each time point, at least, 50 phagosomes were analyzed. *p < 0.05, comparing differences between WT- and p62-KD-BMDM. (D,E) Time-lapse experiments of WT- and p62-KD-BMDM challenged with CFSE labeled-RBC for 15 min (0 min chase time) and followed for 300 min further to assess phagosome degradation. Phagosome degradation (D) was measured by the disappearance of fluorescence and the phagosome assessed by DIC (E). Bars, 10 µm. The values are means ± SD of 10 different phagosomes. **p < 0.01; ***p < 0.001 comparing differences between WT- BMDM and p62-KD-BMDM. (E) DIC images at 0 min and 240 min chase time of WT- BMDM and p62-KD-BMDM. Arrows point to RBC-containing phagosomes.