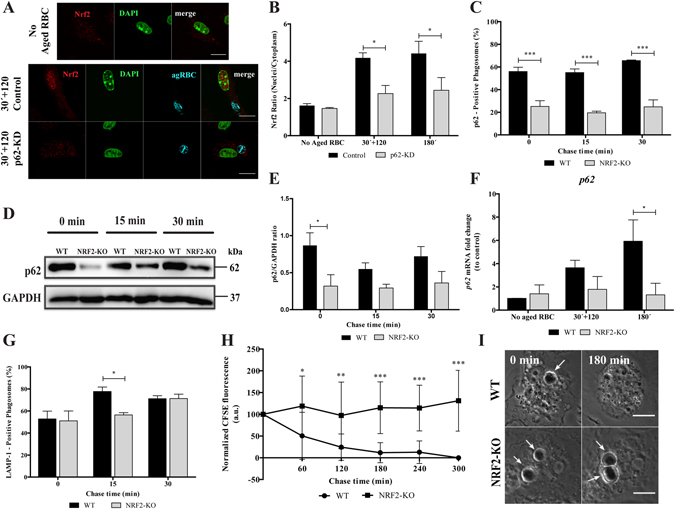
Figure 7.

NRF2 is critical for RBC degradation in BMDM. WT- and p62-KD-BMDM were fed with CFSE-stained RBC for 30 min and then chased for 120 min or fed for 180 min. (A) Translocation of NRF2 into the nucleus in WT- and in p62-KD-BMDM, assessed by immunostaining, in the absence (first row) or upon incubation with RBC (second and third rows). The second row represents NRF2-nuclear translocation in WT-BMDM. The third row represents NRF2-nuclear translocation in p62-KD-BMDM. NRF2 staining is represented in red, nucleus in green and internalized RBC in cyan. The last panels are merged images. Bars, 10 µm. (B) Quantification of NRF2 nuclear translocation expressed as a ratio of the fluorescence intensity between the nucleus and the cytoplasm. *p < 0.05 comparing differences between NRF2 fluorescence in WT-BMDM and p62-KD-BMDM challenged with RBC. (C–F) WT- and NRF2-KO-BMDM were challenged with RBC for 15 min (0 min chase) and then chased for the indicated times in the figures. (C) Quantification of p62-positive phagosomes after fixation and immunostaining for the endogenous protein. (D) p62 levels in total cell lysates of WT- and NRF2-KO-BMDM, for short time points. GAPDH was used as loading control. (E) Ratio of p62/GAPDH of quantified bands in cells exposed to RBC. Three independent experiments were performed. (F) WT- and NRF2-KO-BMDM were challenged with RBC for 30 min and then chased for 120 min or fed for 180 min. The expression of p62 gene was assessed by RT-qPCR. Data were normalized to the endogenous Hprt and Pgk1 genes. The values are means ± SEM expression levels of three independent experiments, each measured in two technical replicates. *p < 0.05. (G) Quantification of LAMP-1-positive phagosomes after fixation and stained for LAMP-1. The values are means ± SEM expression levels of three independent experiments, each measured in two technical replicates. *p < 0.05. (H,I) Time-lapse experiments of WT- and NRF2-KO-BMDM challenged with CFSE labeled-RBC for 15 min (0 min chase time) and followed for 300 min further to assess phagosome degradation. Phagosome degradation was analyzed as described in the legend of Fig. 6. The values are means ± SD of 10 different phagosomes. *p < 0.05; **p < 0.01; ***p < 0.001 comparing differences between WT- and NRF2-KO-BMDM. (H) DIC images at 0 min and 180 min chase time of WT- and NRF2-KO-BMDM. Arrows point to RBC-containing phagosomes.
