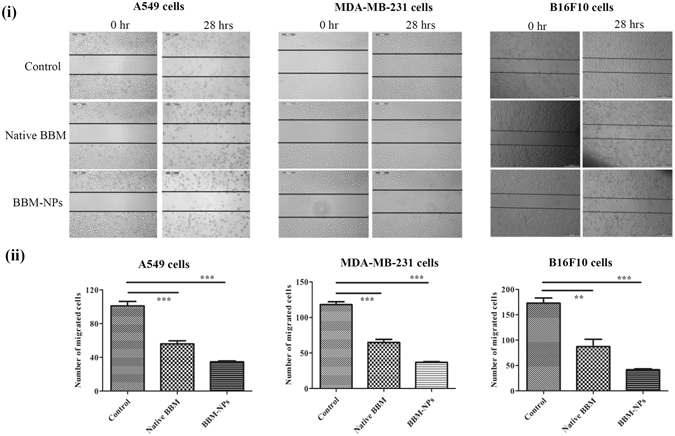
Figure 4.

Inhibition analysis of cell migration by a scratch assay in A549, MDA-MB-231 and B16F10 cells by treatment with Native BBM, BBM-NPs (with 1 μg/ml of mitomycin, a proliferation inhibition marker). (i) Microscopic picture of migrated cells after 28 hrs. (ii) Bar graph represents the number of cells migrated into the scratched area. Values are as mean ± SEM, n = 4, **p < 0.001, ***p < 0.0001 for Native BBM and BBM-NPs vs. control.
