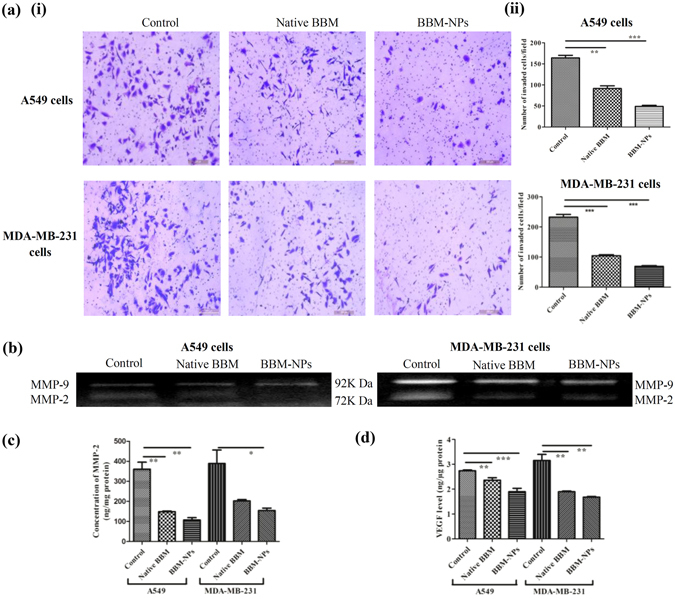
Figure 5.

Analysis of cell invasion by using a modified Boyden Chamber assay.(a) In brief, A549 and MDA-MB-231 cells at a density 2 × 10⁵ were treated with 25 µM Native BBM/BBM-NPs for 24 hrs. After that, cells were harvested and 1 × 10⁵ live cells seeded in the upper chamber of a matrigel-coated transwell plate and invasion assay was studied by microscopy staining with crystal violet after 24 hrs. (i) Microscopic picture of invaded cells. (ii) Bar graph represents the number of cells invaded the matrigel. Values are as mean ± SEM, n = 3, **p < 0.001, ***p < 0.0001 for Native BBM and BBM-NPs vs. control. During invasion assay, the left over supernatants on the upper chamber of transwell insert was collected from all the treatments of both the cells. (b) Inhibition of pro-matrix MMP-9/MMP-2 activation by gelatin zymography (c) MMP-2 level measured by ELISA Kit. Values are as mean ± SEM, n = 3, *p < 0.05, **p < 0.005 vs. control. (d) The secreted VEGF in the supernatants measured by ELISA Kit. Values are as mean ± SEM, n = 3, **p < 0.001, ***p < 0.0001 vs. control.
