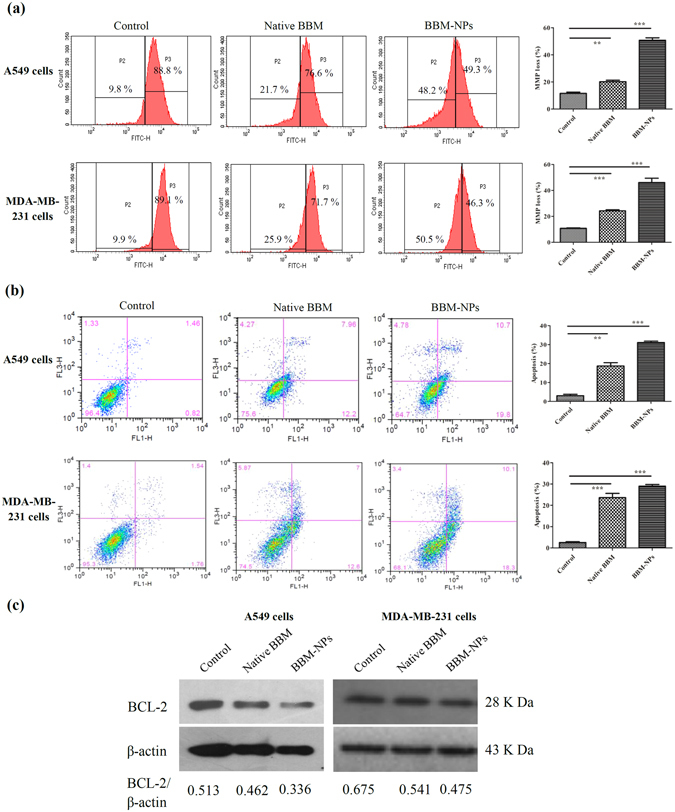
Figure 6.

Analysis of mitochondrial function and apoptosis by flow cytometry and expression of anti-apoptotic protein BCL-2 by western blot analysis. (a) A549 and MDA-MB-231 cells were treated with Native BBM and BBM-NPs (25 µM) for 48 hrs. Cells associated with mitochondrial function using Rhodamine 123 was analyzed by flow cytometry. Values are as mean ± SEM, n = 3, **p < 0.001, ***p < 0.0001 for Native BBM and BBM-NPs vs. control. (b) Induction of apoptosis in A549 and MDA-MB-231 cells treated with Native BBM/BBM-NPs (25 µM) for 48 hrs and percentage of apoptosis (early and late) was measured using Annexin V-FITC by flow cytometry. Values are as mean ± SEM, n = 3, **p < 0.001, ***p < 0.0001 for Native BBM and BBM-NPs vs. control. (c) Western blot analysis of anti-apoptotic protein BCL-2 associated with apoptosis in A549 and MDA-MB-231 cell lines following 25 µM BBM treatments (Native/NPs) for 48 hrs. β-actin serves as loading control.
