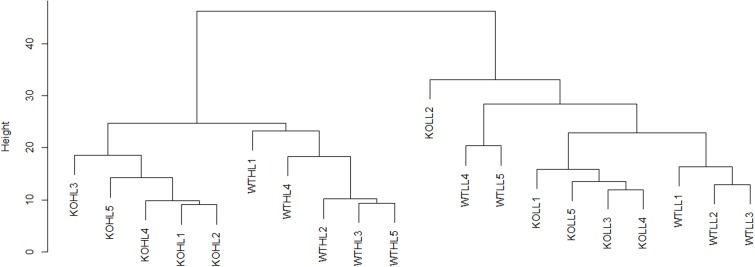
FIGURE 2.
Hierarchical clustering analysis of WT and gpt2 plants exposed to HL. A dendrogram was constructed using log2 scaled intensities for the 1993 quantified proteins, using the Euclidean distance and the complete linkages method. Each of the five biological replicates were plotted for every condition. Clear separation can be seen between LL and HL cluster, and also between WT and gpt2 at HL.

