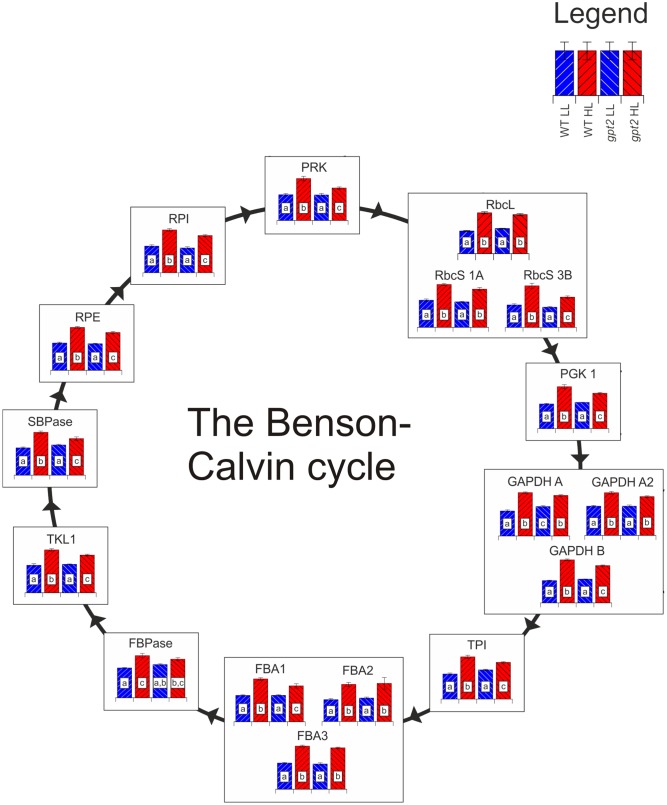
FIGURE 5.
The response of the Benson-Calvin cycle to HL acclimation in WT and gpt2. Quantified proteins are diagrammatically represented in this figure, with each column representing a treatment according to the legend in the top right of the figure. Significantly different results are denoted by different letters within each column (ANOVA, p < 0.05). When more than one protein isoform was quantified, all are shown. Abbreviations: RbcL, Ribulose bisphosphate carboxylase large subunit; RbcS, Ribulose bisphosphate carboxylase small subunit; PGK1, phosphoglycerate kinase 1; GAPDH, glyceraldehyde 3-phosphate dehydrogenase; TPI, triose phosphate isomerase; FBA, fructose-bisphosphate aldolase; FBPase, Fructose 1,6-bisphosphatase; TKL, transketolase; SBPase, sedoheptulose-1,7-bisphosphatase; RPE, ribulose 5-phosphate epimerase; RPI, ribose 5-phosphate isomerase; PRK, phosphoribulokinase. In the case of TPI, too few unique peptides were quantified to allow individual isoform discrimination, so shared peptides between TPI1 and TPI2 were used to quantify total TPI.

