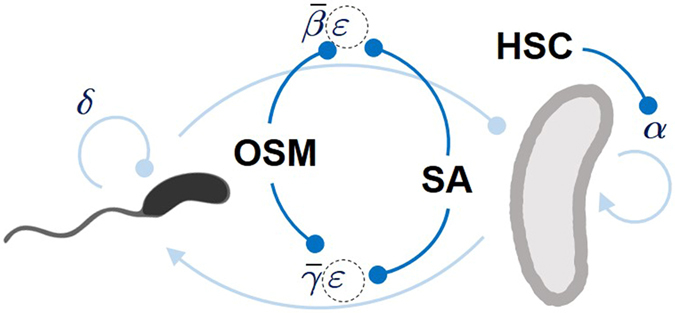
Figure 4.

Schematic diagram of ecological interactions in a microbial predator-prey system. Environmental factors affecting the ecological interaction between the predator (left) and the prey (right). OSM: high osmolarity of the medium, SA: serum albumin, HSC: human serum complement. Arrows indicate a positive contribution to the population growth while the filled circles do a negative contribution. The lighter blue lines represent the Lotka-Volterra model while the darker blue indicate negative impacts of the environmental factors. The changes in OSM and SA is reflected in the parameter ε but not in or .
