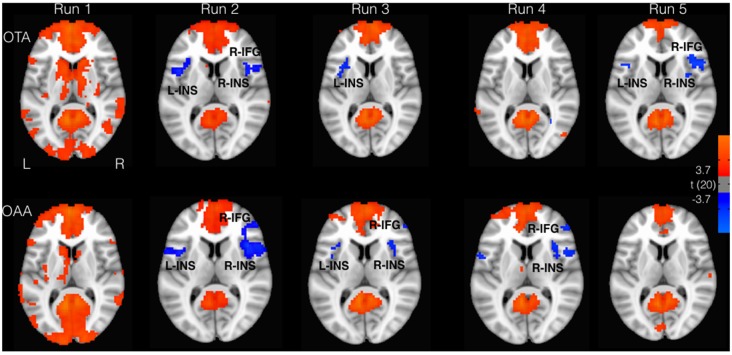
Figure 1.
Areas correlated (red) and anticorrelated (blue) with posterior cingulate cortex (PCC; p < 0.05, false discovery rate (FDR) corrected). Insular cortex (INS) and inferior frontal gyrus (IFG) showed greater anticorrelation for the operator tactile attention (OTA) compared to operator auditory attention (OAA) group.

