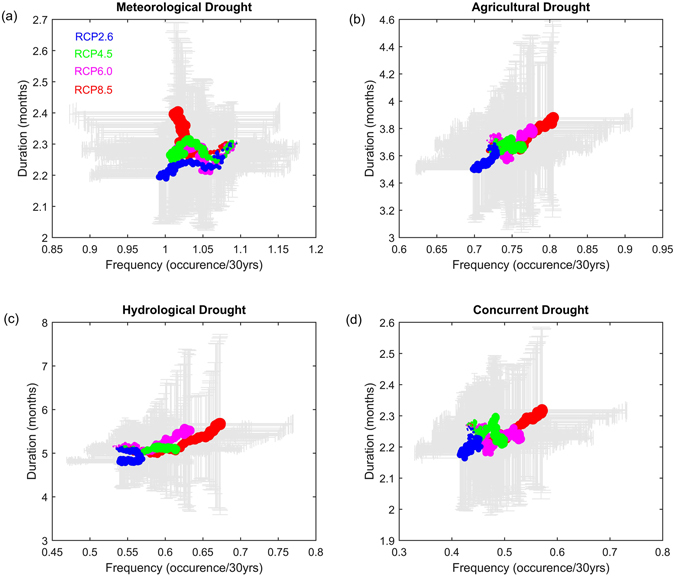
Figure 3.

Changes in relations between US mean frequency and duration of (a) meteorological, (b) agricultural, (c) hydrological and (d) concurrent droughts by CMIP5-VIC simulations under RCP8.5, RCP6.0, RCP4.5 and RCP2.6 scenarios. Dots represent the multi-model ensemble mean values while error bar is for the one standard deviation to show the model ranges. The size of dots are scaled by global warming amount to characterize the regional changes in drought frequency and duration relations with global warming. For example, larger dots indicate larger global warming amounts or later future period given that global mean temperature exhibits an evident increasing trend with time, although there is small variation at the interannual scale. Figure was created using software MATLAB 2015a (http://www.mathworks.com/).
