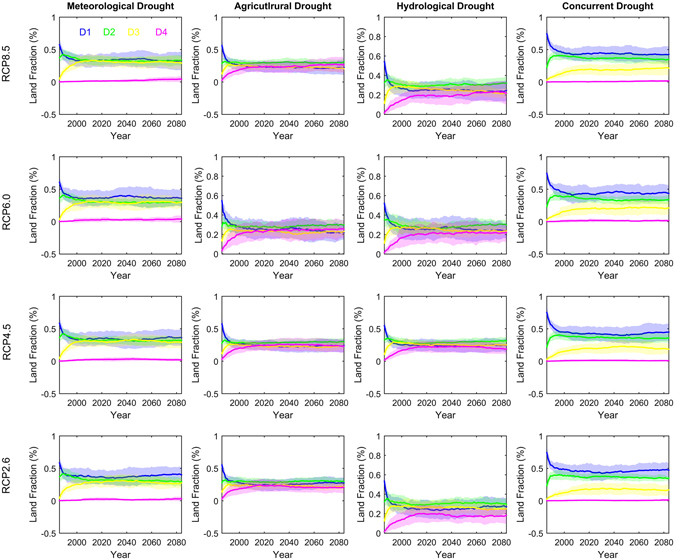
Figure 6.

Fraction of US land area dominated by four categories of durations (i.e. D1, D2, D3 and D4) of meteorological (first column), agricultural (second column), hydrological (third column) and concurrent droughts (fourth column) under RCP8.5, RCP6.0, RCP4.5 and RCP2.6 scenarios. D1, D2, D3 and D4 are droughts with durations of 1~3, 4~6, 7~12, >12 months, respectively. The changes are calculated in a 30-year time window along 1971–2099 relative to 1971–2000. The year axis represents the 30-year period centered at that year. For example, the year 1985 indicates the period 1971–2000. Figure was created using software MATLAB 2015a (http://www.mathworks.com/).
