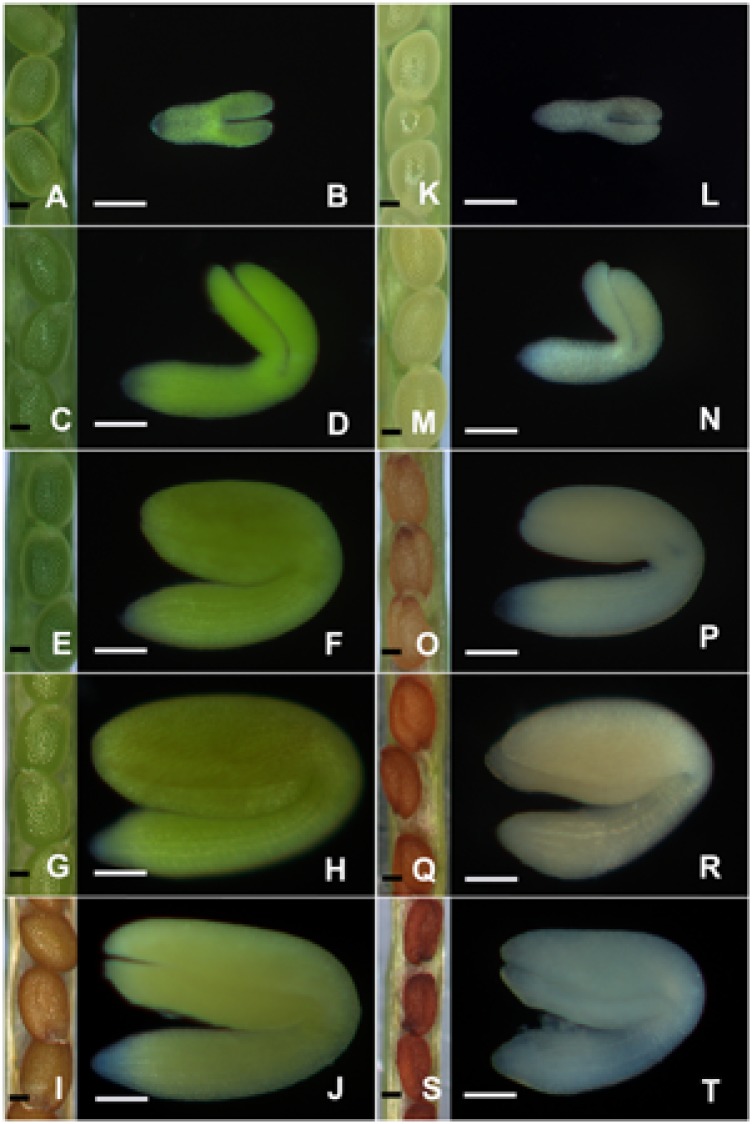
FIGURE 2.

The morphology of ovules/embryos during embryo development. Both the control (A–J) and treated (K–T) ovules/embryos were analyzed with a Zeiss stereomicroscope when they were grown for 6 (A,B,K,L), 8 (C,D,M,N), 10 (E,F,O,P), 12 (G,H,Q,R), and 14 (I,J,S,T) DAP, respectively. Bar = 100 μm.
