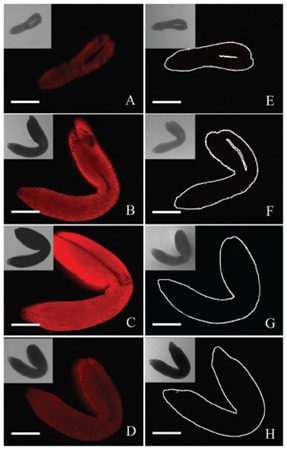
FIGURE 3.

Analysis of chlorophyll fluorescence of control and treated embryos. Both the control (A–D) and treated (E–H) embryos were analyzed with a laser confocal microscope when they were grown for 6 (A,E), 8 (B,F), 10 (C,G), and 12 DAP (D,H), respectively. Inserts represent corresponding bright field (B,F) images. Bar = 100 μm.
