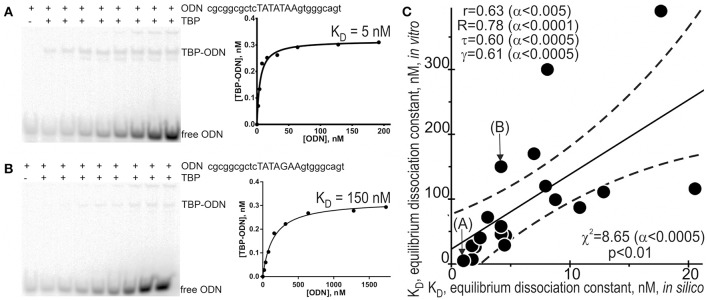
Figure 2.
Experimental verification of the selected candidate SNP markers by an electrophoretic mobility shift assay (EMSA) in vitro. An example of electropherograms in the case of ancestral (A: norm, wild-type, wt) and minor (B: minor) alleles of the candidate SNP marker rs1800202 within the human TPI1 gene promoter, which are accompanied by diagrams of experimentally measured values. (C) The significant correlations between the in silico predicted (X-axis) and in vitro measured (Y-axis) KD values of the equilibrium dissociation constant of the [TBP–ODN] complex. Solid and dashed lines or curves denote the linear regression and boundaries of its 95% confidence interval, calculated using software STATISTICA (Statsoft™ USA). Circles denote the ancestral and minor alleles of the candidate SNP markers rs563763767, rs33980857, rs34598529, rs33931746, rs33981098, rs35518301, rs1143627, rs72661131, rs7277748, and rs1800202 being verified; r, R, τ, γ, χ2, and α are linear correlation, Spearman's rank correlation, Kendall's rank correlation, Goodman–Kruskal generalized correlation, χ2 test, and their significance, respectively; p is Fisher's exact test two marks (A) and (B) indicate by arrows two experimental magnitudes whose measurement procedures are shown in panels A and B, respectively.

