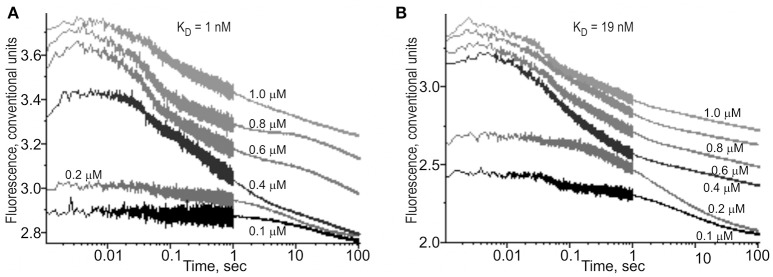
Figure 3.
The kinetics of binding to and bending of the ODN identical to the selected SNP marker rs1800202. (A) The ancestral allele, ODN 5′-cgcggcgctcTATATAAgtgggcagt-3′. (B) The minor allele, ODN 5′-cgcggcgctcTATAgAAgtgggcagt-3′. ODN concentration was 0.1 μM. TBP concentration was varied between 0.1 and 1.0 μM as indicated near the corresponding curve of the time series. KD values, (A) 1 nM and (B) 19 nM, were obtained as the output of the Dynafit software (Biokin, USA) after the corresponding time-series data were inputted into this software.

