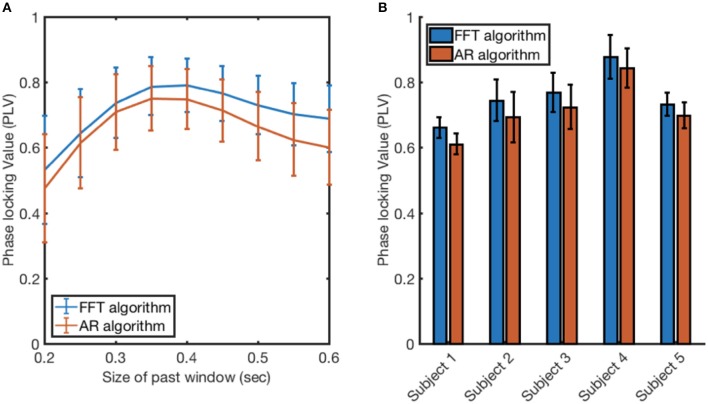
Figure 7.
Evaluating the FFT algorithm and AR algorithm when applied to EEG recording at 10 Hz. (A) The size of the past window was varied between 0.2 and 0.6 s to find the optimal past window size for both algorithms. The value and the error bars at each point were calculated by taking the mean and the standard deviation of the PLV measurements across the 5 participants. (B) The performance of each algorithm measured through PLV when applied to EEG recorded from 5 participants. The value and the error bars at each point were calculated by taking the mean and the standard deviation of the PLV measurements across 64 electrodes.

