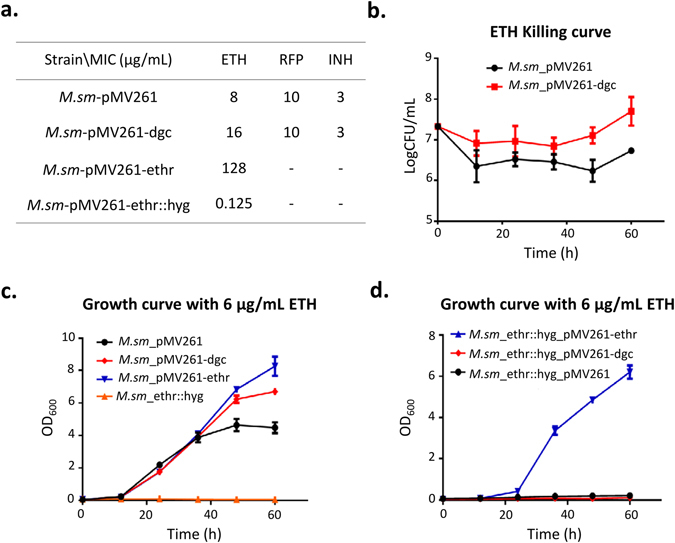
Figure 3.

c-di-GMP increases M.sm resistance to ETH. (a). Antibioctic sensitive assay for the effects of c-di-GMP on different antibiotics. Different strains grew in serially diluted (128–0.125 μg/mL) antibiotics, i.e. ethionamide (ETH), rifampicin (RFP), or isoniazidea (INH). MIC represent the lowest concentration of drug under which strains can grow. (b). Time-Kill curve for M.sm during 60 h. The curve is depicted by the growth of M.sm-pMV261 and M.sm-pMV261-dgc under 120 μg/mL ETH at interval of 12 h. The concetration of ETH chosed is 15-fold MIC of M.sm-pMV261. (c,d). Growth curve for M.sm under 6 μg/mL during 60 h. The curves are depicted by the growth of M.sm-pMV261, M.sm-pMV261-dgc, M.sm-pMV261-ethr, and M.sm-ethr::hyg under 6 μg/mL ETH at interval of 12 h (c) and by the growth of M.sm-ethr::hyg-pMV261, M.sm-ethr::hyg-pMV261-dgc, M.sm-ethr::hyg-pMV261-ethr under 6 μg/mL ETH at interval of 12 h (d). Means ± standard deviation (S.D.) represent the variant range of the data derived from three biological replicates.
