
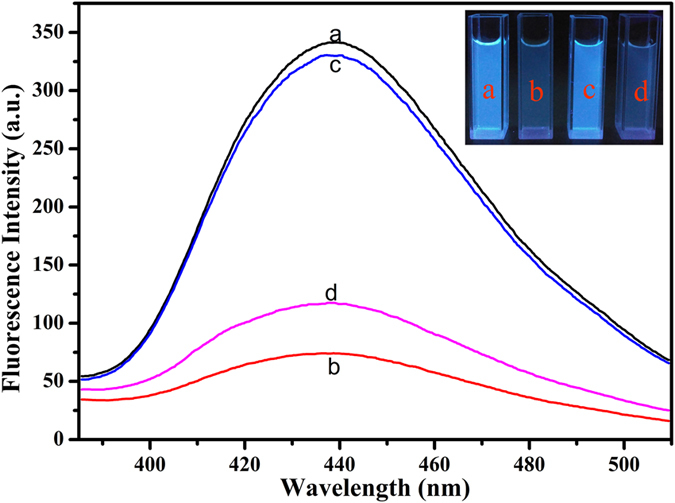
Figure 3.
Fluorescence spectra and image of N-CDs in the presence of different composition (a) mere N-CDs; (b) in the presence of 5 μM Cu2+; (c) in the presence of 5 μM Cu2+ and 50 μM PPi; (d) in the presence of 5 μM Cu2+, 50 μM PPi and 1 U/mL ALP.
Official websites use .gov
A
.gov website belongs to an official
government organization in the United States.
Secure .gov websites use HTTPS
A lock (
) or https:// means you've safely
connected to the .gov website. Share sensitive
information only on official, secure websites.
Fluorescence spectra and image of N-CDs in the presence of different composition (a) mere N-CDs; (b) in the presence of 5 μM Cu2+; (c) in the presence of 5 μM Cu2+ and 50 μM PPi; (d) in the presence of 5 μM Cu2+, 50 μM PPi and 1 U/mL ALP.