
Figure 2.
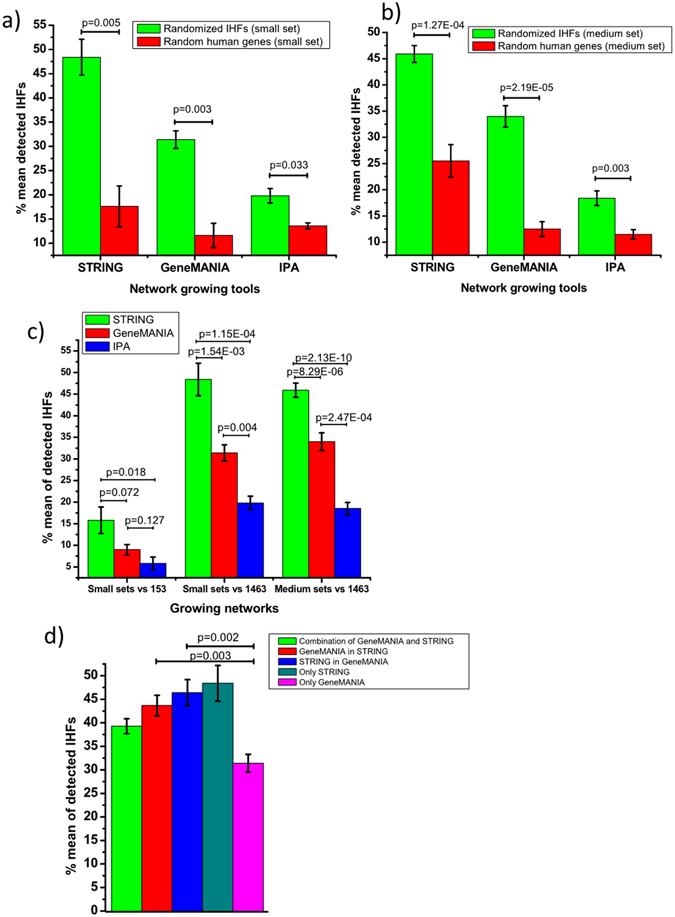
Detection rate of network growing tools after randomization of IHFs and random human proteins. (a) Comparison of the detection performance of the network growing tools after growing 100 genes using either small set (30 genes) IHFs or random human proteins as seeds and 1463 IHFs as positive sets. P-values are the result of a paired Student-t test analysis. (b) Comparison of the detection performance of the network growing tools after growing 100 genes using either medium set (146 genes) IHFs or random human proteins as seeds and 1463 IHFs as positive sets. P-values are the result of a paired Student-t test analysis. (c) Detection performance comparison of the three network growing tools (d) The detection rate of STRING and GeneMANIA after combination and interchange of the 1st 50 grown genes.