
Figure 3.
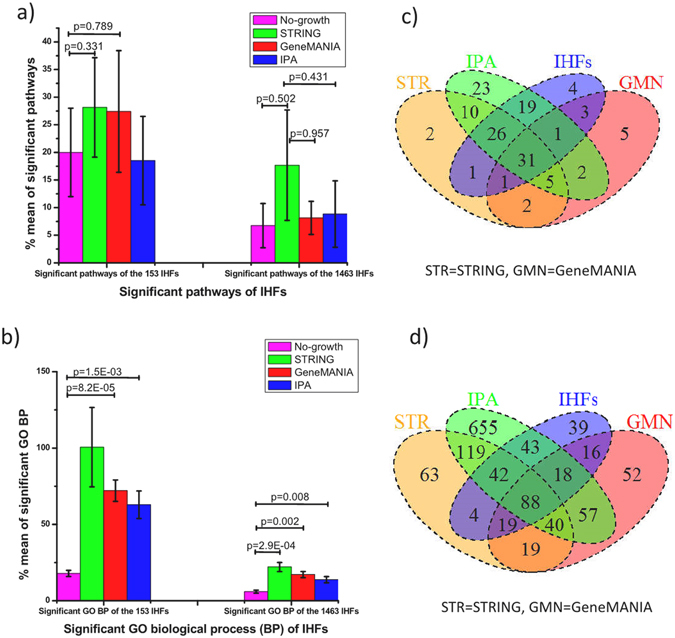
Performance comparison of the three network growing tools in terms of KEGG pathways and GO BP. (a) Rate of overlapping KEGG pathways before and after network growing relative to pathways of the 153 and 1463 known IHFs. (b) Rate of overlapping GO BP of the grown genes relative to GO BP of the 153 and 1463 known IHFs. (c) Pairwise analysis of KEGG pathways from the grown genes in the network growing tools and KEGG pathways of the positive sets (1463 IHFs) (d) Pairwise analysis of GO BP from the grown genes in the network growing tools and GO BP of the positive sets (1463 IHFs).