
Figure 2.
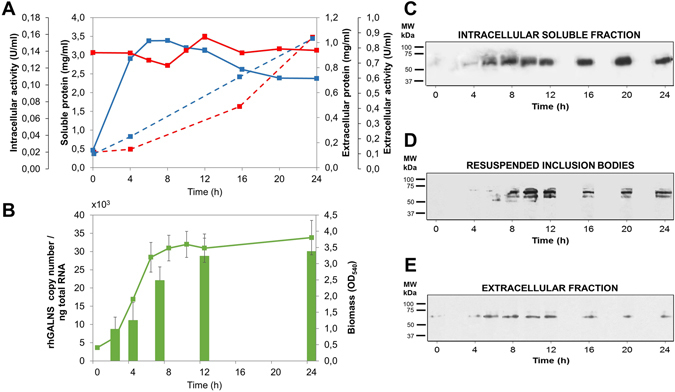
Dynamics of the expression of rhGALNS under the control of the promoter proU mod. (A) The solid lines represent the soluble protein quantitation expressed as mg/mL. Dashed lines indicate volumetric enzymatic activities expressed as U/mL. Blue lines show soluble proteins and enzyme activity of the intracellular fraction, whereas red lines are for the samples analyzed at the culture medium. These samples were analyzed at 0, 4, 6, 8, 10, 12, 16, 20 and 24 hours. (B) The green solid line shows the biomass measured as OD540 at 0, 2, 4, 6, 8, 10, 12 and 24 hours. Green bars represent the rhGALNS copy number per ng of total RNA, isolated at 2, 4, 7, 12 and 24 hours after inoculation. The expression profile of the promoter proU mod shown corresponds to the profile expected of promoters regulated under σ s. Western-blot analyses of rhGALNS at the, (C) Intracellular soluble fraction, (D) Solubilized protein aggregates fraction and (E) Extracellular fraction. All samples were collected at the same timestamps analyzed in part (A) Samples from the intracellular fraction were normalized by the total protein amount, solubilized protein aggregates fractions were normalized by biomass, and the extracellular samples were normalized by culture volume. A non-cropped version of this figure can be found in the Supplementary Data.