Figure 1.

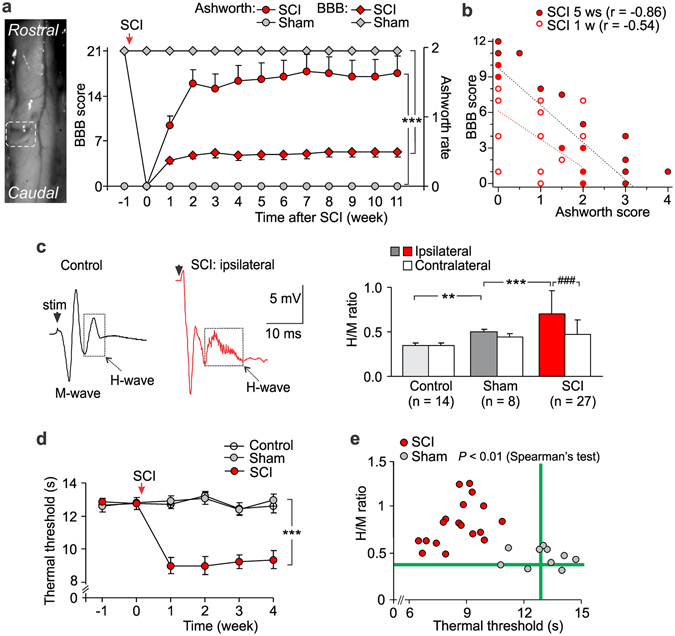
The SCI-induced spasticity correlates with chronic pain. (a) Left, image of the spinal cord immediately after the lesion (white box indicates the lesion site, Th11). Right, summary of the BBB (left Y axis) scaling of animal locomotion and the Ashworth rate (right Y axis) of long-lasting impairments in muscle tone on the ipsilateral side postoperatively (n = 32 SCI-injured rats, n = 14 sham-operated animals). ***P < 0.001 (two-way repeated analysis of variance and Bonferroni post-hoc test). (b) The BBB score estimated for each animal at week 1 and week 5 post-SCI (n = 32 animals) plotted against its Ashworth scoring value. The Pearson correlation coefficients (r) are indicated. (c) Left, examples of the H-reflex recordings, demonstrating the M- and the H-wave responses in control and post-SCI at ~1 month postoperatively. Right, the ratio of the H- to the-M-wave amplitudes in different experimental groups. ### P < 0.001 (paired t-test), **p < 0.01, ***p < 0.001 (unpaired t-test). (d) The time course of changes in the thermal nociceptive threshold of the ipsilateral hindpaw in different groups of animals, demonstrating experiencing of the long-lasting pain post-SCI (n = 11 control, n = 14 sham-operated rats and n = 15 animals post-SCI). ***P < 0.001 (ANOVA with Bonferroni post-hoc test). (e) The H-reflex measurements (the H/M ratio) plotted against the thermal nociceptive threshold estimated for a respective animal at the time-point of ~1 month postoperatively for the sham-operated (n = 10 animals) and the SCI groups (n = 18 animals). The Spearman’s test significance is indicated. Green lines indicate the average parameters in control animals (no surgery). Data are expressed as mean; error bars, SEM.
