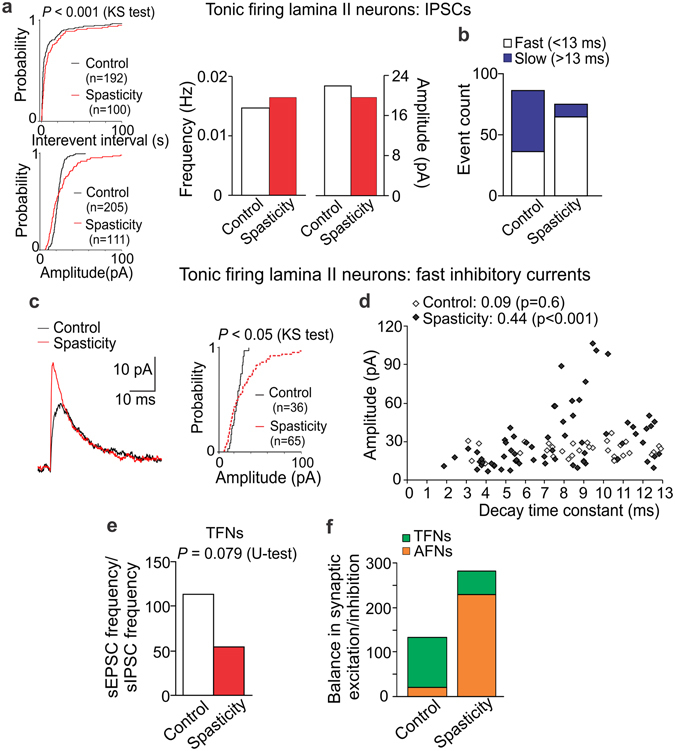
Figure 7.

The SCI-induced reshuffle between GABAergic and glycinergic inhibition in TFNs. (a) Cumulative probability plots for the inter-event interval and the amplitude of sIPSCs (left) and summary of the median frequency and the median current amplitude (right) in TFNs in control and spasticity. (b) Occurrence of the fast (τ < 13 ms) and the slow (τ > 13 ms) inhibitory currents in TFNs in control and spasticity. (c) Examples of the fast inhibitory currents (left) and cumulative probability plots for the current amplitude (right) in TFNs in control and spasticity. The currents are average from 25 fast sIPSCs recorded in 11 TFNs in control (black line) and 53 fast sIPSCs recorded in 11 cells in spastic animals (red line). (d) The amplitude of fast sIPSCs plotted against the correspondent decay constant in TFNs from control and spastic animals. The Spearman correlation coefficients with the Spearman’s non-parametric test significance are indicated. (e) The average balance between synaptic excitation and inhibition of TFNs, estimated as the median frequency of sEPSCs to the median frequency of sIPSCs for each individual TFN in control (n = 10 cells) and spasticity (n = 9 cells). (f) The relative balance between excitatory drive and synaptic inhibition of AFNs and TFNs in control and post-SCI. The Kolmogorov-Smirnov (KS) or the Mann-Whitney U-test significance is indicated.
