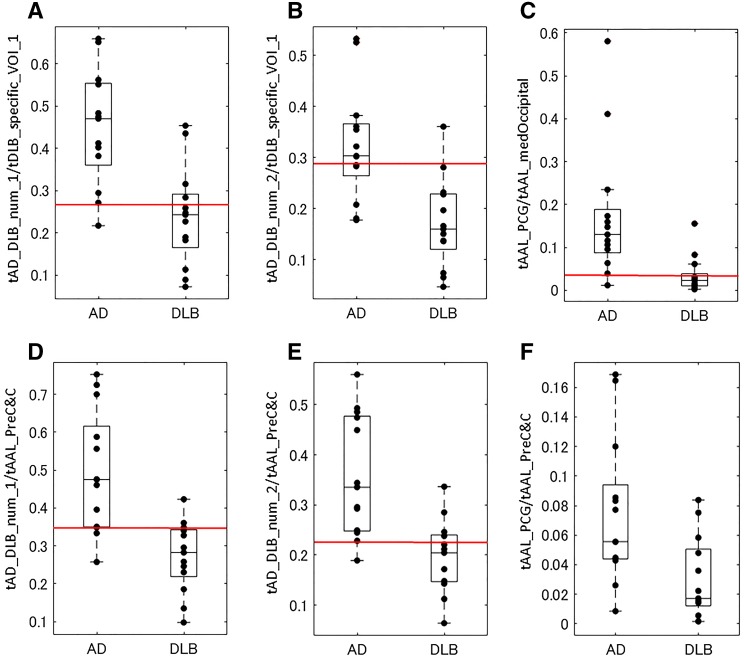
Fig. 2.
Box plots of CIS ratios with optimized VOIs and AAL VOIs. a tAD_DLB_num_1/tDLB_specific_VOI_1; b CISRo: tAD_DLB_num_2/tDLB_specific_VOI_1; c CISRaal: tAAL_PCG/tAAL_medOccipital; d CISRmix: tAD_DLB_num_1/tAAL_PreC&C; e tAD_DLB_num_2/tAAL_PreC&C; f CIS: tAAL_PCG/tAAL_PreC&C. The boxes indicate the upper and lower quartiles with the median, and the whiskers show the minimum, maximum, or 1.5 × interquartile ranges. The red lines on a–e indicate the thresholds shown in Table 3

