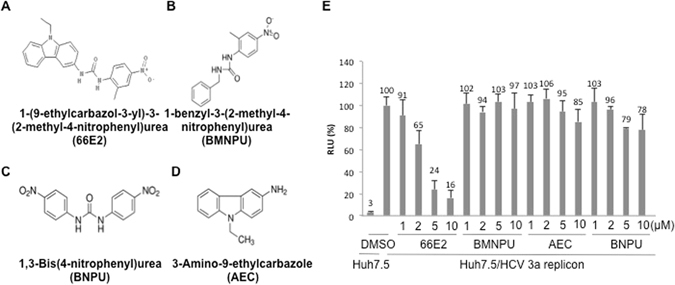
Figure 3.

Structure Activity Relationship Analysis. (A–D) Structure of 66E2 and its derivatives are depicted. (E) G418 resistant HCV-3a replicon expressing Huh7.5 cells were treated with varying concentrations of these compounds. Levels of RNA replication was monitored using the firefly reporter and plotted as % RLU as in Fig. 2A. The assays were performed in triplicates and results presented are representative of three independent assays. The % mean is shown above the bars and the error bars are standard deviations.
