
Figure 2.
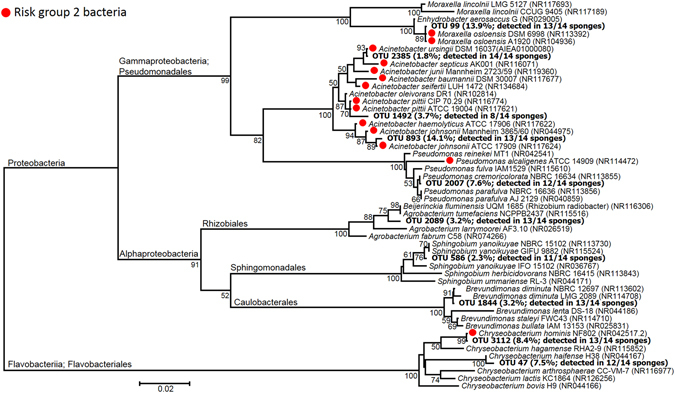
Neighbor-joining phylogenetic tree of the ten most abundant OTUs in the analyzed kitchen sponges, as retrieved by pyrosequencing of 16S rRNA gene amplicon libraries. The relative abundance (percentage of the total sequence dataset) and the detection frequency (number of sponges where they were detected) are given in parenthesis after the OTU number. The most similar reference sequences retrieved by BLAST and EzTaxon alignment (type strains only) were included in the tree, followed by the corresponding accession numbers. Red circles indicate risk group 2 organisms, according to the German Technical Rule for Biological Agents No. 466 (TRBA 46631). Numbers at the nodes indicate percentage values of 1000 bootstrap re–samplings (only percentages ≥ 50 are shown). Scale bar represents substitution rate per nucleotide position.